
ES频繁触发GC
事件描述
晚上业务高峰时段,ES频繁触发GC,导致聊天记录查询速度变慢,导致聊天记录查询失败。
问题排查
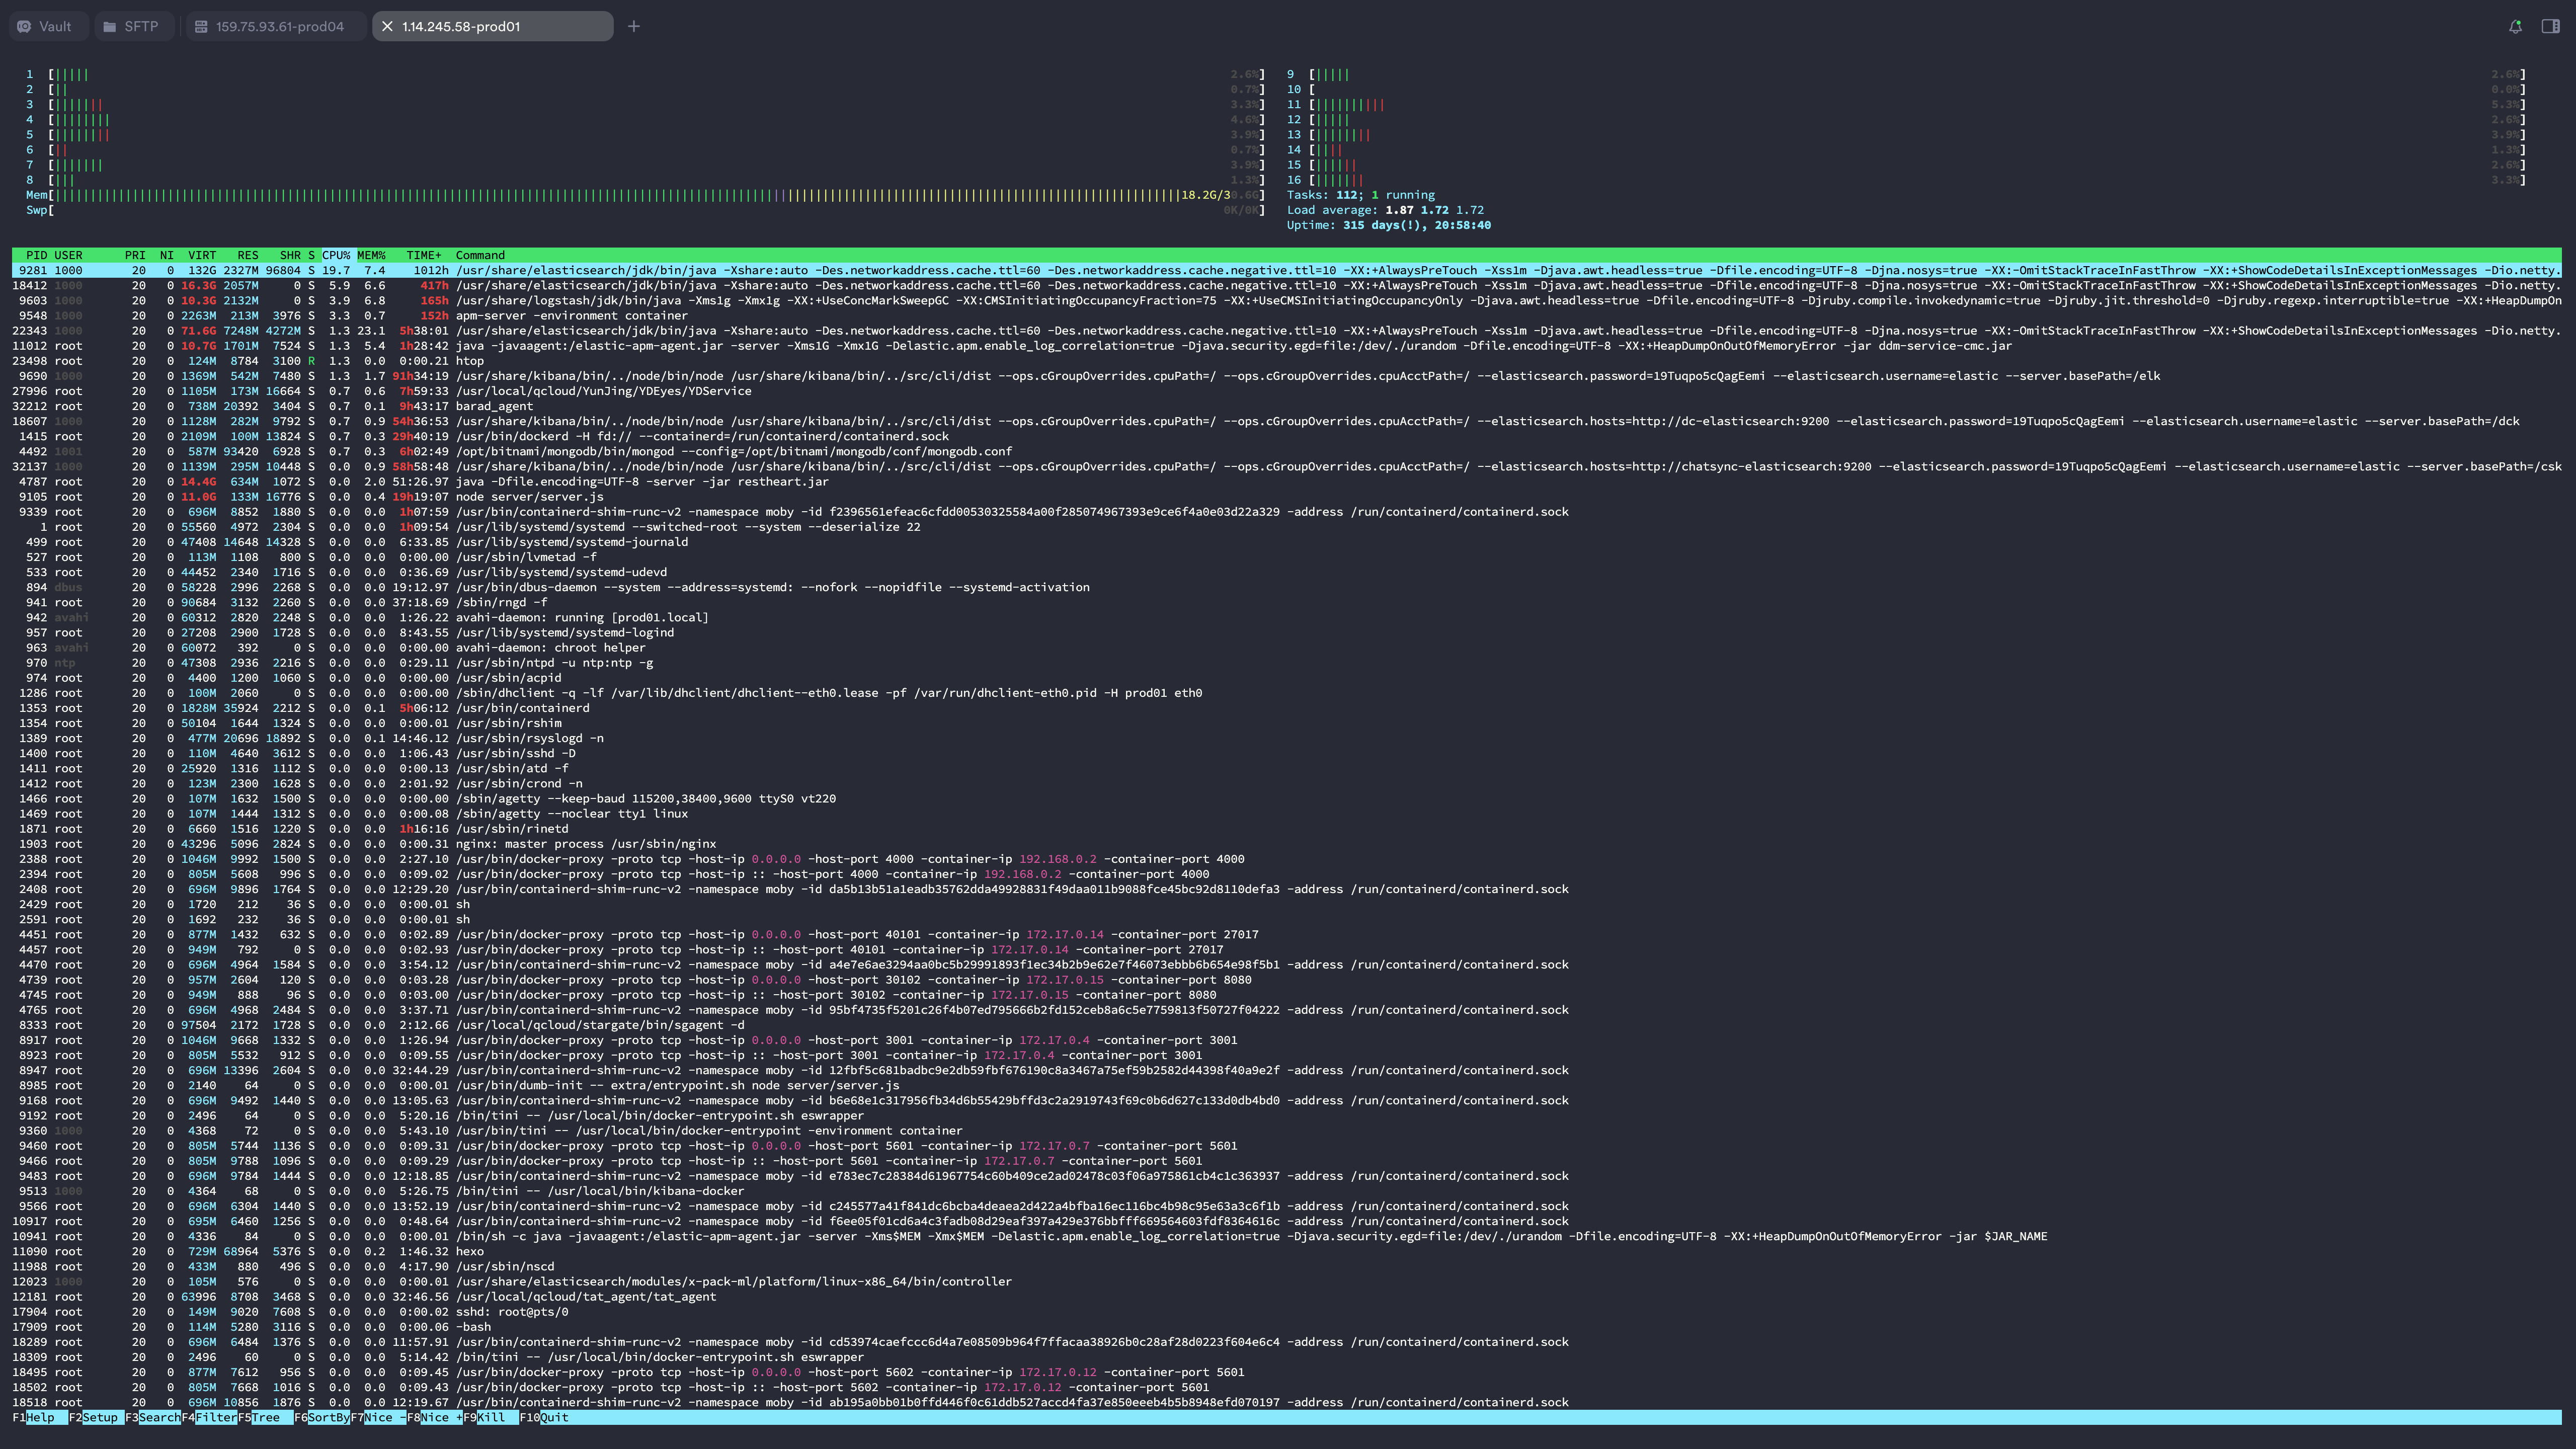
一、应用服务器负载
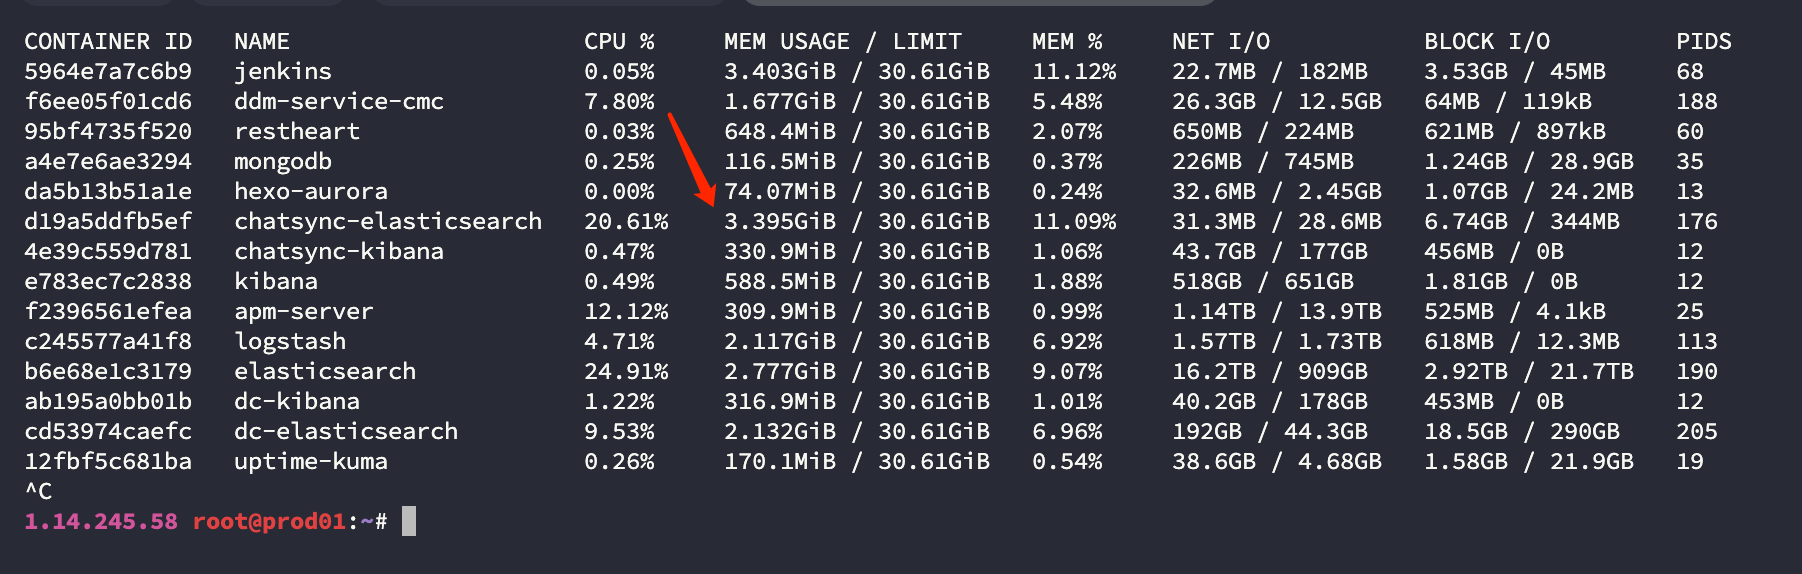
检查发现,没有明显负载偏高的服务器。CPU占用30%左右,属于正常范畴。
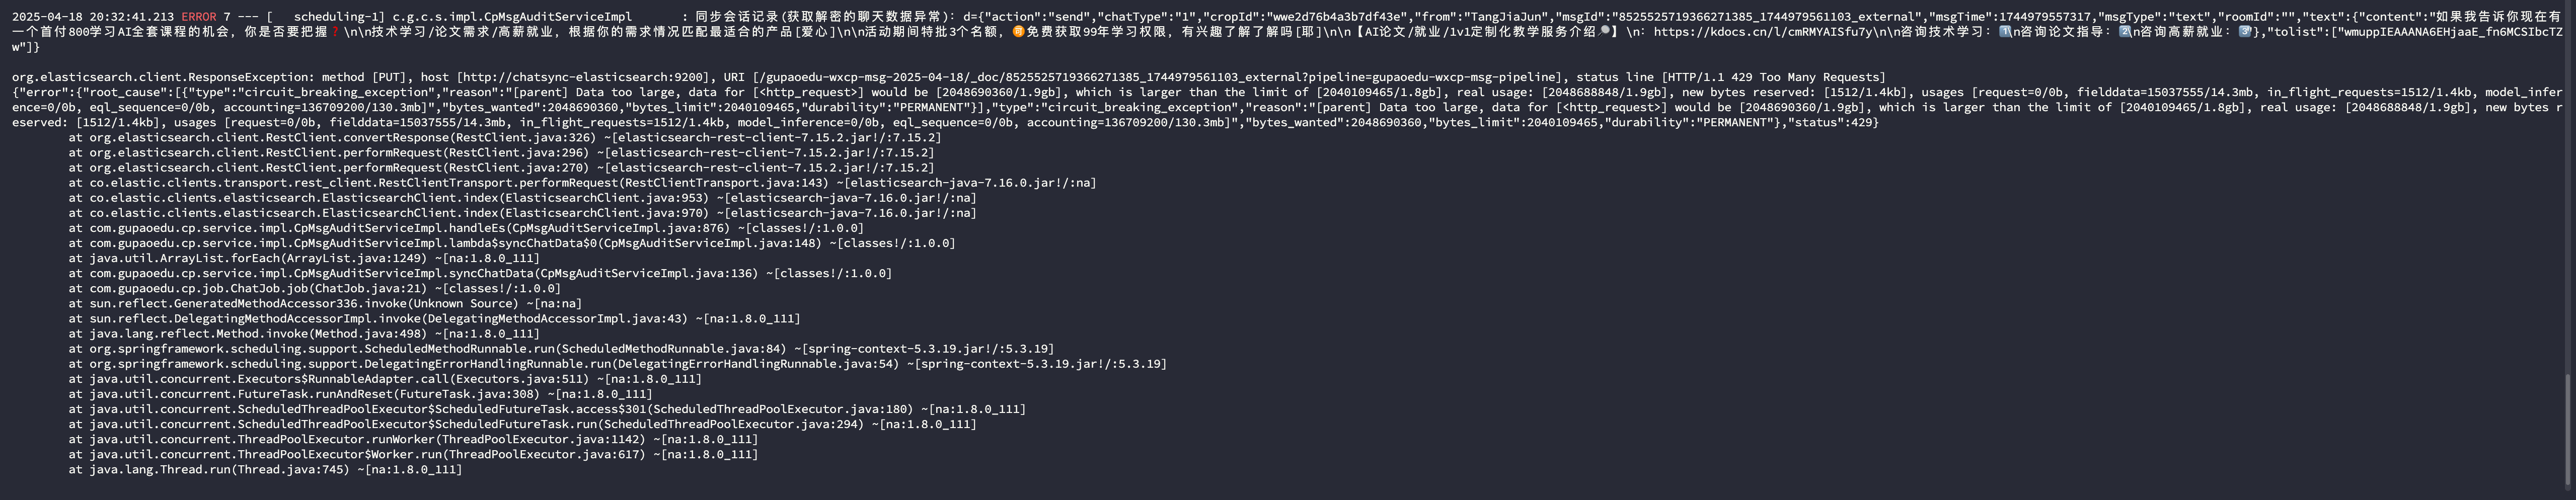
查看应用服务器日志,确认是由于ES会话存档服务不可用导致。
bash
2025-04-18 20:32:52.592 ERROR 7 --- [   scheduling-1] c.g.c.s.impl.CpMsgAuditServiceImpl       : 同步会话记录(获取解密的聊天数据异常):d={"action":"send","chatType":"1","cropId":"wwe2d76b4a3b7df43e","from":"hxy","msgId":"11884897456304615238_1744979571249_external","msgTime":1744979567006,"msgType":"text","roomId":"","text":{"content":"晚上好呀~还有考虑跟着咱们系统学习嘛"},"tolist":["wmuppIEAAAv07OzAOrssXXX8fXpZ6jHA"]}

org.elasticsearch.client.ResponseException: method [PUT], host [http://chatsync-elasticsearch:9200], URI [/gupaoedu-wxcp-msg-2025-04-18/_doc/11884897456304615238_1744979571249_external?pipeline=gupaoedu-wxcp-msg-pipeline], status line [HTTP/1.1 429 Too Many Requests]
{"error":{"root_cause":[{"type":"circuit_breaking_exception","reason":"[parent] Data too large, data for [<http_request>] would be [2048057188/1.9gb], which is larger than the limit of [2040109465/1.8gb], real usage: [2048056584/1.9gb], new bytes reserved: [604/604b], usages [request=0/0b, fielddata=15037555/14.3mb, in_flight_requests=604/604b, model_inference=0/0b, eql_sequence=0/0b, accounting=136693188/130.3mb]","bytes_wanted":2048057188,"bytes_limit":2040109465,"durability":"PERMANENT"}],"type":"circuit_breaking_exception","reason":"[parent] Data too large, data for [<http_request>] would be [2048057188/1.9gb], which is larger than the limit of [2040109465/1.8gb], real usage: [2048056584/1.9gb], new bytes reserved: [604/604b], usages [request=0/0b, fielddata=15037555/14.3mb, in_flight_requests=604/604b, model_inference=0/0b, eql_sequence=0/0b, accounting=136693188/130.3mb]","bytes_wanted":2048057188,"bytes_limit":2040109465,"durability":"PERMANENT"},"status":429}
        at org.elasticsearch.client.RestClient.convertResponse(RestClient.java:326) ~[elasticsearch-rest-client-7.15.2.jar!/:7.15.2]
        at org.elasticsearch.client.RestClient.performRequest(RestClient.java:296) ~[elasticsearch-rest-client-7.15.2.jar!/:7.15.2]
        at org.elasticsearch.client.RestClient.performRequest(RestClient.java:270) ~[elasticsearch-rest-client-7.15.2.jar!/:7.15.2]
        at co.elastic.clients.transport.rest_client.RestClientTransport.performRequest(RestClientTransport.java:143) ~[elasticsearch-java-7.16.0.jar!/:na]
        at co.elastic.clients.elasticsearch.ElasticsearchClient.index(ElasticsearchClient.java:953) ~[elasticsearch-java-7.16.0.jar!/:na]
        at co.elastic.clients.elasticsearch.ElasticsearchClient.index(ElasticsearchClient.java:970) ~[elasticsearch-java-7.16.0.jar!/:na]
        at com.gupaoedu.cp.service.impl.CpMsgAuditServiceImpl.handleEs(CpMsgAuditServiceImpl.java:876) ~[classes!/:1.0.0]
        at com.gupaoedu.cp.service.impl.CpMsgAuditServiceImpl.lambda$syncChatData$0(CpMsgAuditServiceImpl.java:148) ~[classes!/:1.0.0]
        at java.util.ArrayList.forEach(ArrayList.java:1249) ~[na:1.8.0_111]
        at com.gupaoedu.cp.service.impl.CpMsgAuditServiceImpl.syncChatData(CpMsgAuditServiceImpl.java:136) ~[classes!/:1.0.0]
        at com.gupaoedu.cp.job.ChatJob.job(ChatJob.java:21) ~[classes!/:1.0.0]
        at sun.reflect.GeneratedMethodAccessor336.invoke(Unknown Source) ~[na:na]
        at sun.reflect.DelegatingMethodAccessorImpl.invoke(DelegatingMethodAccessorImpl.java:43) ~[na:1.8.0_111]
        at java.lang.reflect.Method.invoke(Method.java:498) ~[na:1.8.0_111]
        at org.springframework.scheduling.support.ScheduledMethodRunnable.run(ScheduledMethodRunnable.java:84) ~[spring-context-5.3.19.jar!/:5.3.19]
        at org.springframework.scheduling.support.DelegatingErrorHandlingRunnable.run(DelegatingErrorHandlingRunnable.java:54) ~[spring-context-5.3.19.jar!/:5.3.19]
        at java.util.concurrent.Executors$RunnableAdapter.call(Executors.java:511) ~[na:1.8.0_111]
        at java.util.concurrent.FutureTask.runAndReset(FutureTask.java:308) ~[na:1.8.0_111]
        at java.util.concurrent.ScheduledThreadPoolExecutor$ScheduledFutureTask.access$301(ScheduledThreadPoolExecutor.java:180) ~[na:1.8.0_111]
        at java.util.concurrent.ScheduledThreadPoolExecutor$ScheduledFutureTask.run(ScheduledThreadPoolExecutor.java:294) ~[na:1.8.0_111]
        at java.util.concurrent.ThreadPoolExecutor.runWorker(ThreadPoolExecutor.java:1142) ~[na:1.8.0_111]
        at java.util.concurrent.ThreadPoolExecutor$Worker.run(ThreadPoolExecutor.java:617) ~[na:1.8.0_111]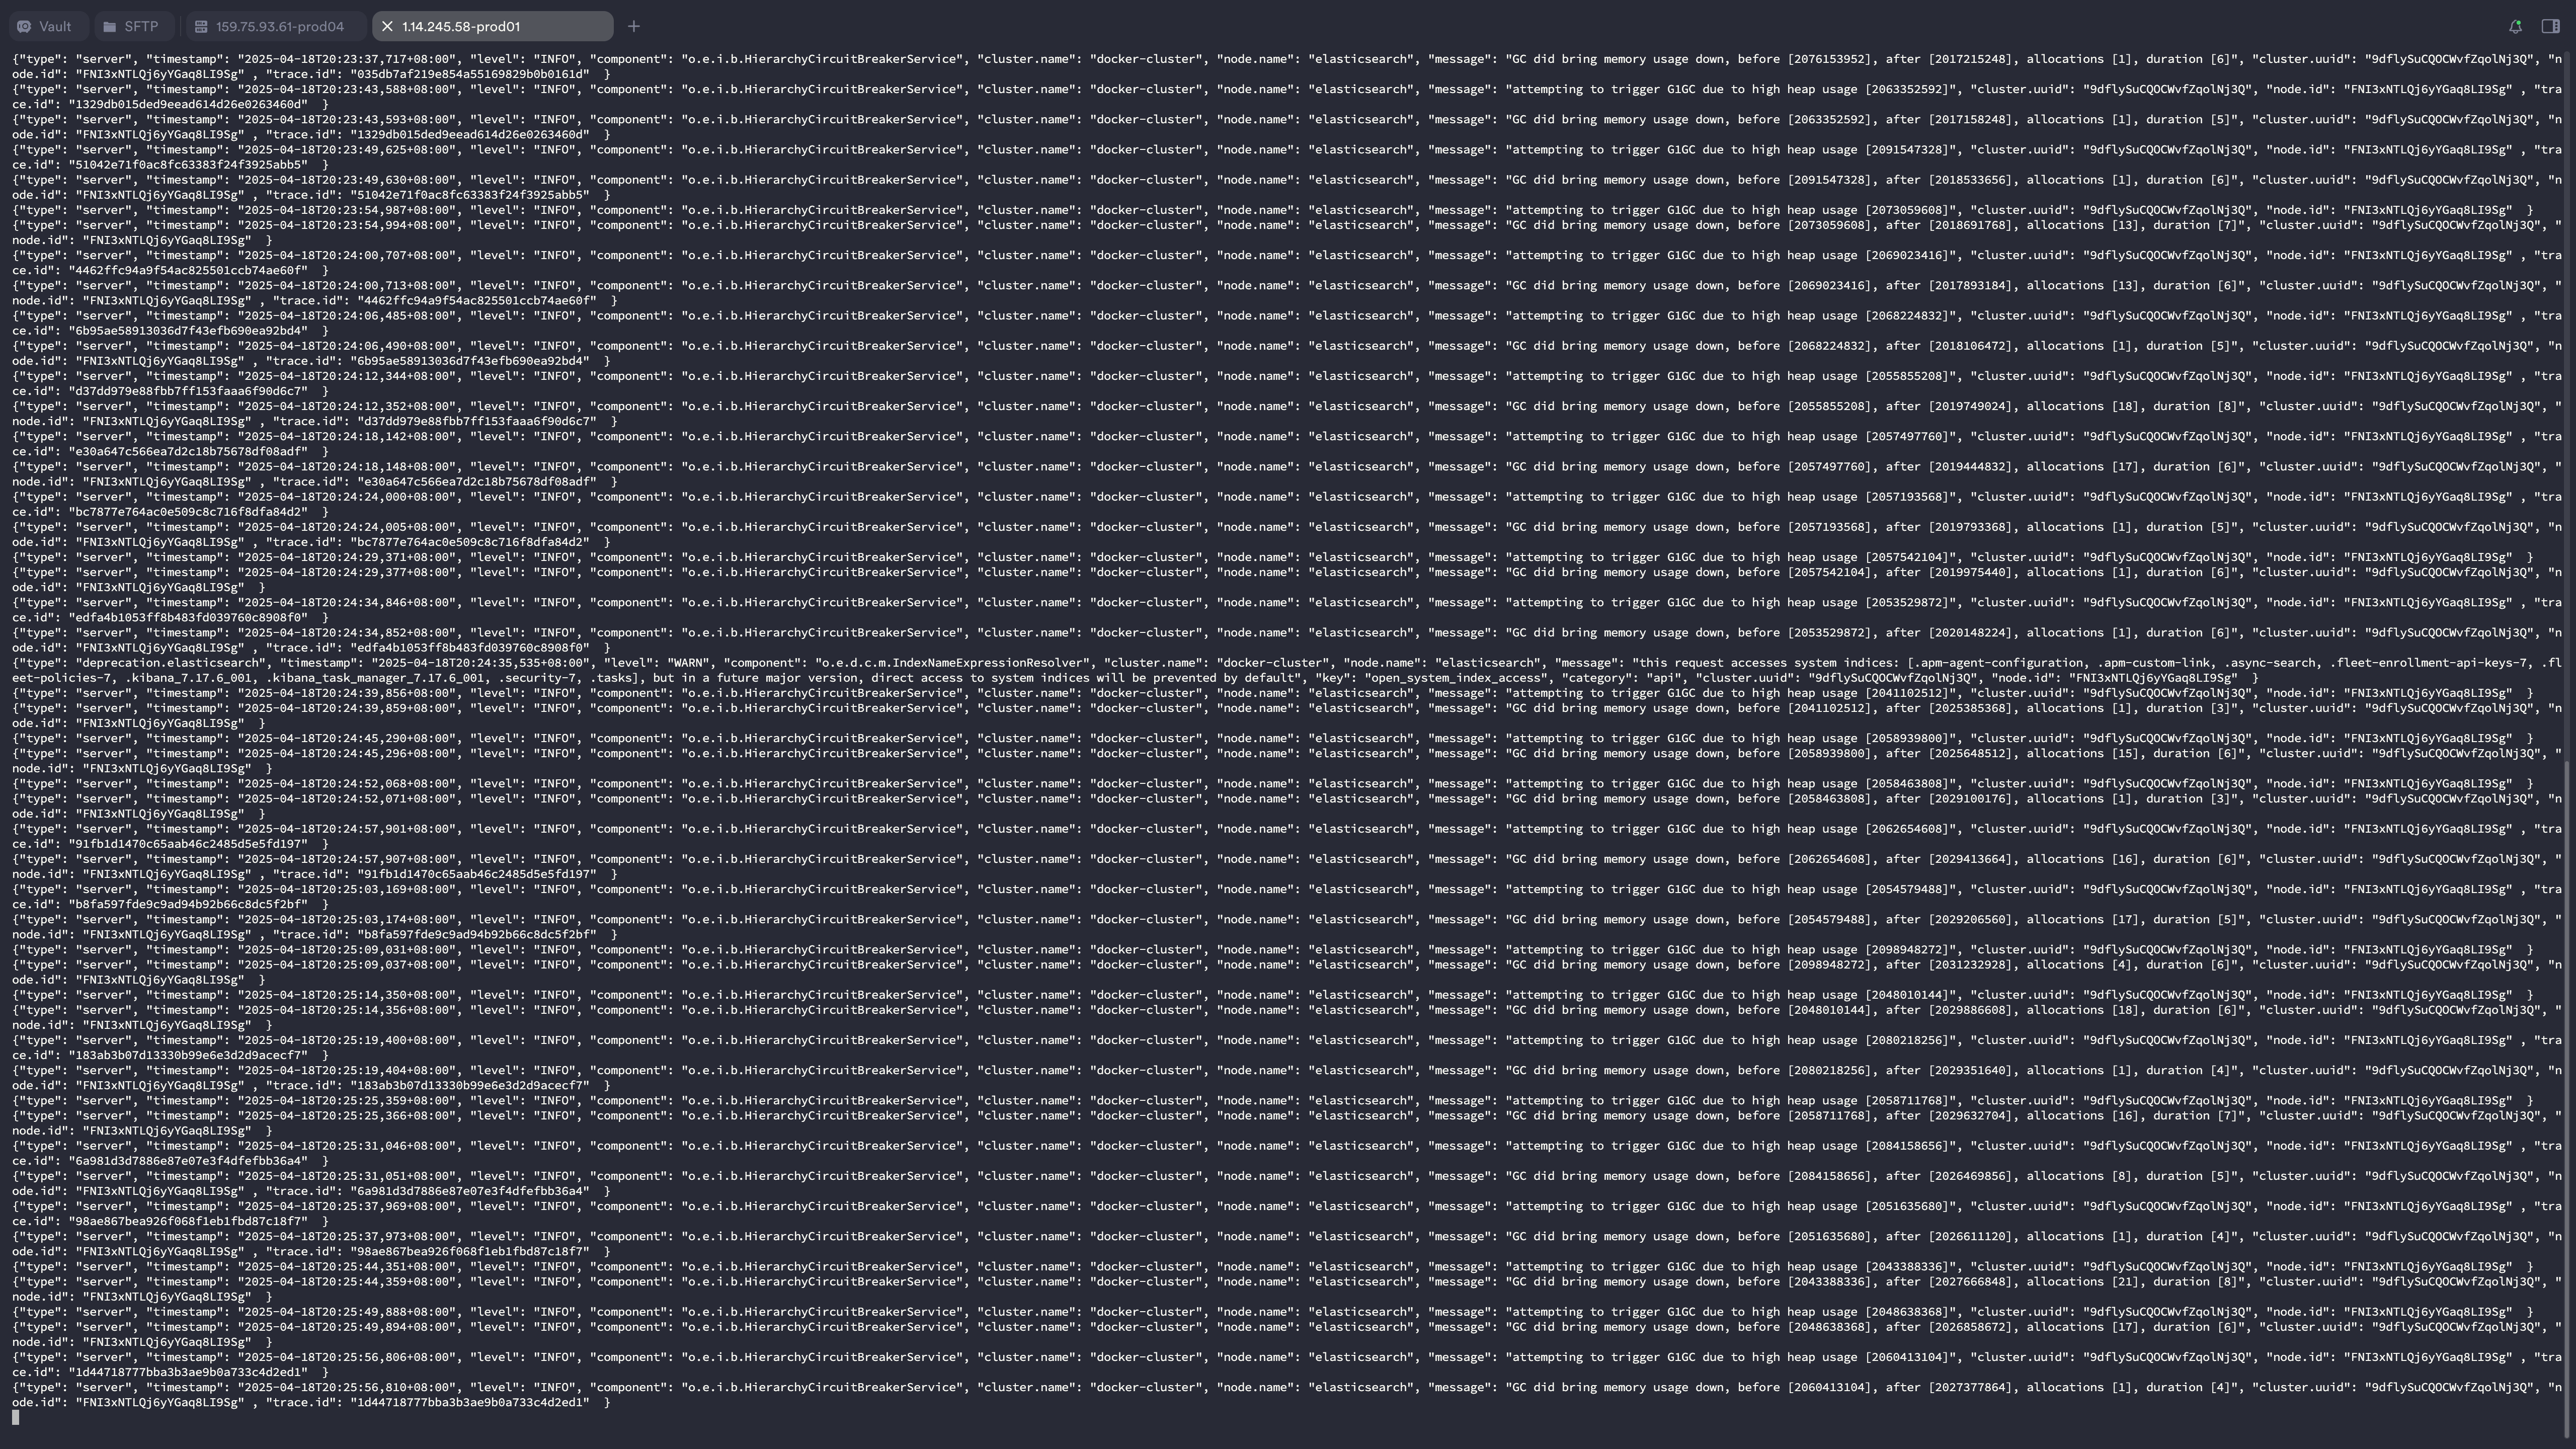
at java.lang.Thread.run(Thread.java:745) ~[na:1.8.0_111]二、查看ES日志
频繁触发GC
bash
{"type": "server", "timestamp": "2025-04-18T20:19:52,712+08:00", "level": "INFO", "component": "o.e.i.b.HierarchyCircuitBreakerService", "cluster.name": "docker-cluster", "node.name": "elasticsearch", "message": "attempting to trigger G1GC due to high heap usage [2078806240]", "cluster.uuid": "9dflySuCQOCWvfZqolNj3Q", "node.id": "FNI3xNTLQj6yYGaq8LI9Sg"  }
{"type": "server", "timestamp": "2025-04-18T20:19:52,717+08:00", "level": "INFO", "component": "o.e.i.b.HierarchyCircuitBreakerService", "cluster.name": "docker-cluster", "node.name": "elasticsearch", "message": "GC did bring memory usage down, before [2078806240], after [2019524400], allocations [10], duration [5]", "cluster.uuid": "9dflySuCQOCWvfZqolNj3Q", "node.id": "FNI3xNTLQj6yYGaq8LI9Sg"  }
{"type": "server", "timestamp": "2025-04-18T20:19:59,728+08:00", "level": "INFO", "component": "o.e.i.b.HierarchyCircuitBreakerService", "cluster.name": "docker-cluster", "node.name": "elasticsearch", "message": "attempting to trigger G1GC due to high heap usage [2040164720]", "cluster.uuid": "9dflySuCQOCWvfZqolNj3Q", "node.id": "FNI3xNTLQj6yYGaq8LI9Sg" , "trace.id": "f96cecb18829ff29bb423cc0ddd75bf9"  }
{"type": "server", "timestamp": "2025-04-18T20:19:59,734+08:00", "level": "INFO", "component": "o.e.i.b.HierarchyCircuitBreakerService", "cluster.name": "docker-cluster", "node.name": "elasticsearch", "message": "GC did bring memory usage down, before [2040164720], after [2020173600], allocations [19], duration [6]", "cluster.uuid": "9dflySuCQOCWvfZqolNj3Q", "node.id": "FNI3xNTLQj6yYGaq8LI9Sg" , "trace.id": "f96cecb18829ff29bb423cc0ddd75bf9"  }
{"type": "server", "timestamp": "2025-04-18T20:20:04,754+08:00", "level": "INFO", "component": "o.e.i.b.HierarchyCircuitBreakerService", "cluster.name": "docker-cluster", "node.name": "elasticsearch", "message": "attempting to trigger G1GC due to high heap usage [2070505248]", "cluster.uuid": "9dflySuCQOCWvfZqolNj3Q", "node.id": "FNI3xNTLQj6yYGaq8LI9Sg" , "trace.id": "66737b910895a41a8ce8736956f92adb"  }
{"type": "server", "timestamp": "2025-04-18T20:20:04,757+08:00", "level": "INFO", "component": "o.e.i.b.HierarchyCircuitBreakerService", "cluster.name": "docker-cluster", "node.name": "elasticsearch", "message": "GC did bring memory usage down, before [2070505248], after [2018318408], allocations [1], duration [3]", "cluster.uuid": "9dflySuCQOCWvfZqolNj3Q", "node.id": "FNI3xNTLQj6yYGaq8LI9Sg" , "trace.id": "66737b910895a41a8ce8736956f92adb"  }
{"type": "server", "timestamp": "2025-04-18T20:20:09,853+08:00", "level": "INFO", "component": "o.e.i.b.HierarchyCircuitBreakerService", "cluster.name": "docker-cluster", "node.name": "elasticsearch", "message": "attempting to trigger G1GC due to high heap usage [2068650056]", "cluster.uuid": "9dflySuCQOCWvfZqolNj3Q", "node.id": "FNI3xNTLQj6yYGaq8LI9Sg"  }
{"type": "server", "timestamp": "2025-04-18T20:20:09,860+08:00", "level": "INFO", "component": "o.e.i.b.HierarchyCircuitBreakerService", "cluster.name": "docker-cluster", "node.name": "elasticsearch", "message": "GC did bring memory usage down, before [2068650056], after [2017759232], allocations [15], duration [7]", "cluster.uuid": "9dflySuCQOCWvfZqolNj3Q", "node.id": "FNI3xNTLQj6yYGaq8LI9Sg"  }
{"type": "server", "timestamp": "2025-04-18T20:20:15,846+08:00", "level": "INFO", "component": "o.e.i.b.HierarchyCircuitBreakerService", "cluster.name": "docker-cluster", "node.name": "elasticsearch", "message": "attempting to trigger G1GC due to high heap usage [2089062400]", "cluster.uuid": "9dflySuCQOCWvfZqolNj3Q", "node.id": "FNI3xNTLQj6yYGaq8LI9Sg"  }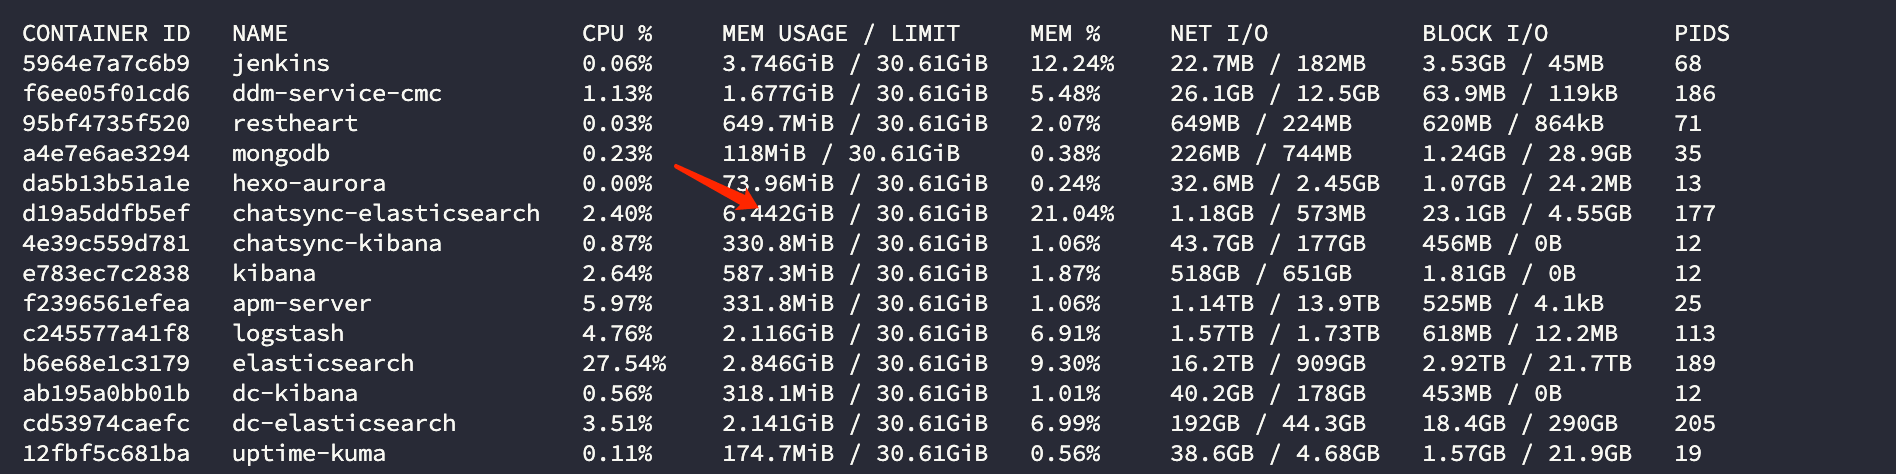
{"type": "server", "timestamp": "2025-04-18T20:20:15,859+08:00", "level": "INFO", "component": "o.e.i.b.HierarchyCircuitBreakerService", "cluster.name": "docker-cluster", "node.name": "elasticsearch", "message": "GC did bring memory usage down, before [2089062400], after [2017483544], allocations [9], duration [13]", "cluster.uuid": "9dflySuCQOCWvfZqolNj3Q", "node.id": "FNI3xNTLQj6yYGaq8LI9Sg" }内存占用过高。
查看设置
bash
GET /_cluster/settingsjson
{
  "persistent" : {
    "cluster" : {
      "max_shards_per_node" : "3000"
    }
  },
  "transient" : { }
}解决方案
重启容器
后续方案
考虑扩容多个节点