采集NGINX日志
快速开始
索引在 Index Management > Data Streams 中
bash
curl -L -O https://artifacts.elastic.co/downloads/beats/filebeat/filebeat-7.16.0-x86_64.rpm
sudo rpm -vi filebeat-7.16.0-x86_64.rpm

# vim /etc/filebeat/filebeat.yml
# vim nginx.conf
# 配置ES索引模板和管道

# 测试输出
filebeat -e -d "publish"

# 测试没问题后,启动服务
service filebeat startyaml
filebeat.inputs:
  - type: log
    enabled: true
    paths:
      - "/var/log/nginx/*.log"
    json.keys_under_root: true
    json.overwrite_keys: true
    json.add_error_key: true

processors:
  - timestamp:
      field: "timestamp"
      layouts:
        - "2006-01-02T15:04:05-07:00"
      timezone: "Asia/Shanghai"
      ignore_failure: true

  - rename:
      fields:
        - from: "client_ip"
          to: "source.ip"
      ignore_missing: true

  - drop_fields:
      fields:
        - "agent"
        - "ecs"
        - "input"
        - "host"
        - "log"
      ignore_missing: true

setup.template:
  name: "nginx-json-template"
  pattern: "nginx-json-*"

setup.ilm.enabled: false

output.elasticsearch:
  hosts: ["localhost:9200"]
  username: "elastic"
  password: "***"
  index: "nginx-json-%{+yyyy.MM.dd}"
pipeline: "nginx_json_pipeline"nginx
log_format main_json escape=json
    '{'
        '"timestamp": "$time_iso8601",'
        '"client_ip": "$remote_addr",'
        '"x_forwarded_for": "$http_x_forwarded_for",'
        '"remote_user": "$remote_user",'
        '"method": "$request_method",'
        '"uri": "$request_uri",'
        '"protocol": "$server_protocol",'
        '"status": $status,'
        '"body_bytes_sent": $body_bytes_sent,'
        '"request_length": $request_length,'
        '"request_time": $request_time,'
        '"response_time": "$upstream_response_time",'
        '"upstream_connect_time": "$upstream_connect_time",'
        '"upstream_header_time": "$upstream_header_time",'
        '"http_host": "$http_host",'
        '"scheme": "$scheme",'
        '"referer": "$http_referer",'
        '"user_agent": "$http_user_agent",'
        '"upstream_addr": "$upstream_addr",'
        '"upstream_status": "$upstream_status",'
        '"upstream_response_length": "$upstream_response_length",'
        '"server_name": "$server_name",'
        '"server_addr": "$server_addr",'
        '"server_port": "$server_port",'
        '"ssl_protocol": "$ssl_protocol",'
        '"ssl_cipher": "$ssl_cipher"'
'}';bash
PUT _ingest/pipeline/nginx_json_pipeline
{
  "description": "Parse nginx JSON logs: geoip + user_agent + uri path",
  "processors": [
    {
      "geoip": {
        "field": "source.ip",
        "target_field": "geo",
        "ignore_missing": true
      }
    },
    {
      "user_agent": {
        "field": "user_agent",
        "target_field": "user_agent_info",
        "ignore_missing": true
      }
    },
    {
      "uri_parts": {
        "field": "uri",
        "target_field": "uri_info",
        "ignore_failure": true
      }
    },
    {
      "uri_parts": {
        "field": "referer",
        "target_field": "referer_info",
        "ignore_failure": true
      }
    }
  ]
}bash
PUT _index_template/nginx-json-template
{
  "index_patterns": ["nginx-json-*"],
  "template": {
    "settings": {
      "number_of_shards": 1,
      "number_of_replicas": 0
    },
    "mappings": {
      "dynamic": "true",
      "properties": {
        "@timestamp": { "type": "date" },
        "timestamp": { "type": "date" },
        "source": {
          "properties": {
            "ip": { "type": "ip" }
          }
        },
        "geo": {
          "properties": {
            "ip": { "type": "ip" },
            "country_name": { "type": "keyword" },
            "city_name": { "type": "keyword" },
            "location": { "type": "geo_point" }
          }
        },
        "client_ip": { "type": "ip" },
        "upstream_addr": { "type": "keyword" },
        "status": { "type": "integer" },
        "upstream_status": { "type": "keyword" },
        "request_time": { "type": "float" },
        "response_time": { "type": "keyword" },
        "upstream_connect_time": { "type": "keyword" },
        "upstream_header_time": { "type": "keyword" },
        "upstream_response_length": { "type": "keyword" },
        "body_bytes_sent": { "type": "long" },
        "request_length": { "type": "long" },
        "method": { "type": "keyword" },
        "uri": { "type": "text" },
        "protocol": { "type": "keyword" },
        "http_host": { "type": "keyword" },
        "scheme": { "type": "keyword" },
        "server_name": { "type": "keyword" },
        "server_addr": { "type": "ip" },
        "server_port": { "type": "keyword" },
        "ssl_protocol": { "type": "keyword" },
        "ssl_cipher": { "type": "keyword" },
        "user_agent": { "type": "text" },
        "referer": { "type": "text" },
        "x_forwarded_for": { "type": "text" },
        "remote_user": { "type": "keyword" },
        "log_type": { "type": "keyword" }
      }
    }
  },
  "priority": 100,
  "version": 1,
  "data_stream": { }
}Elastic经典-快速搭建ELK-采集NGINX日志
一、搭建centos环境
编辑compose-centos.yml文件
yaml
version: '3'

services:

  centos:
    image: centos:centos8.4.2105
    container_name: centos
    restart: unless-stopped
    ports:
      - 8000:80
    environment:
      - TZ=Asia/Shanghai
		stdin_open: true # -i interactive
    tty: true # -t tty
    privileged: true

networks:
  default:
    external:
name: 'es-kibana-logstash-net'启动容器
bash
docker-compose -f compose-centos.yml up -d进入容器
bash
docker exec -it centos bash二、安装Nginx
安装nginx
bash
yum install -y nginx启动nginx
bash
nginx确认nginx安装成功:http://127.0.0.1:8000/

三、安装filebeat,上报nginx日志
打开kibana,选择可观测性 > 集成 > 浏览集成
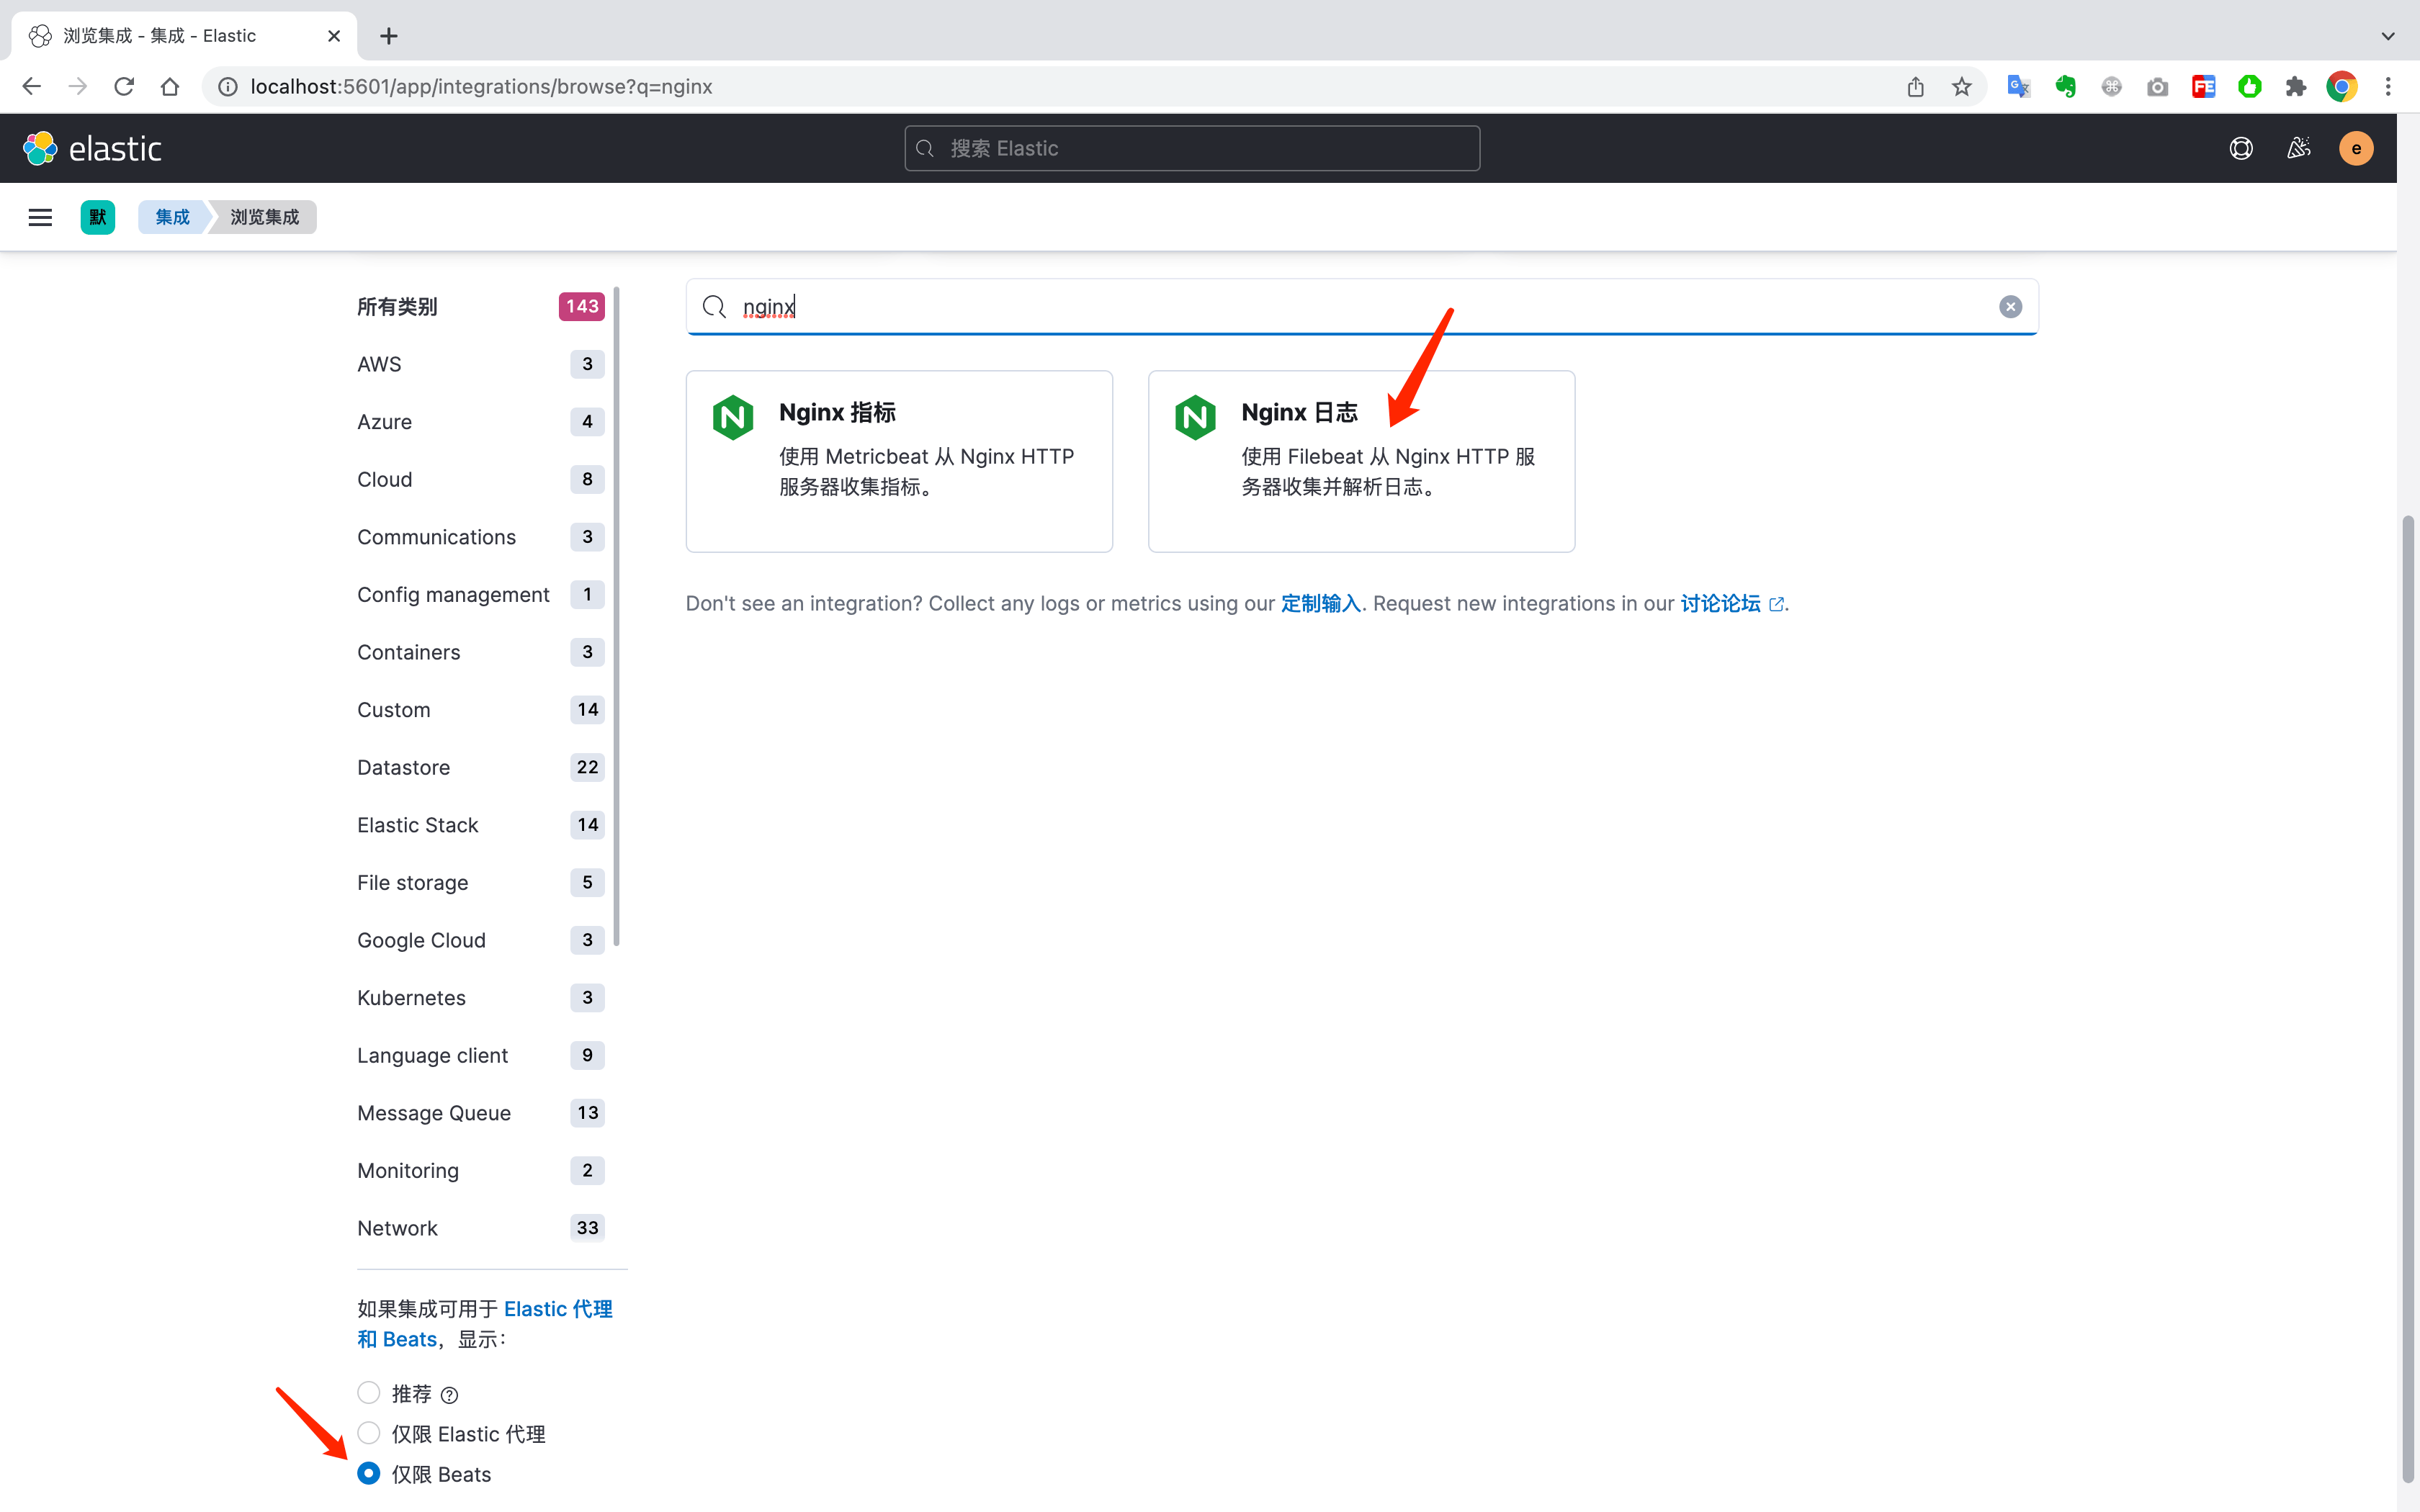
选择仅限Beats 选择nginx日志
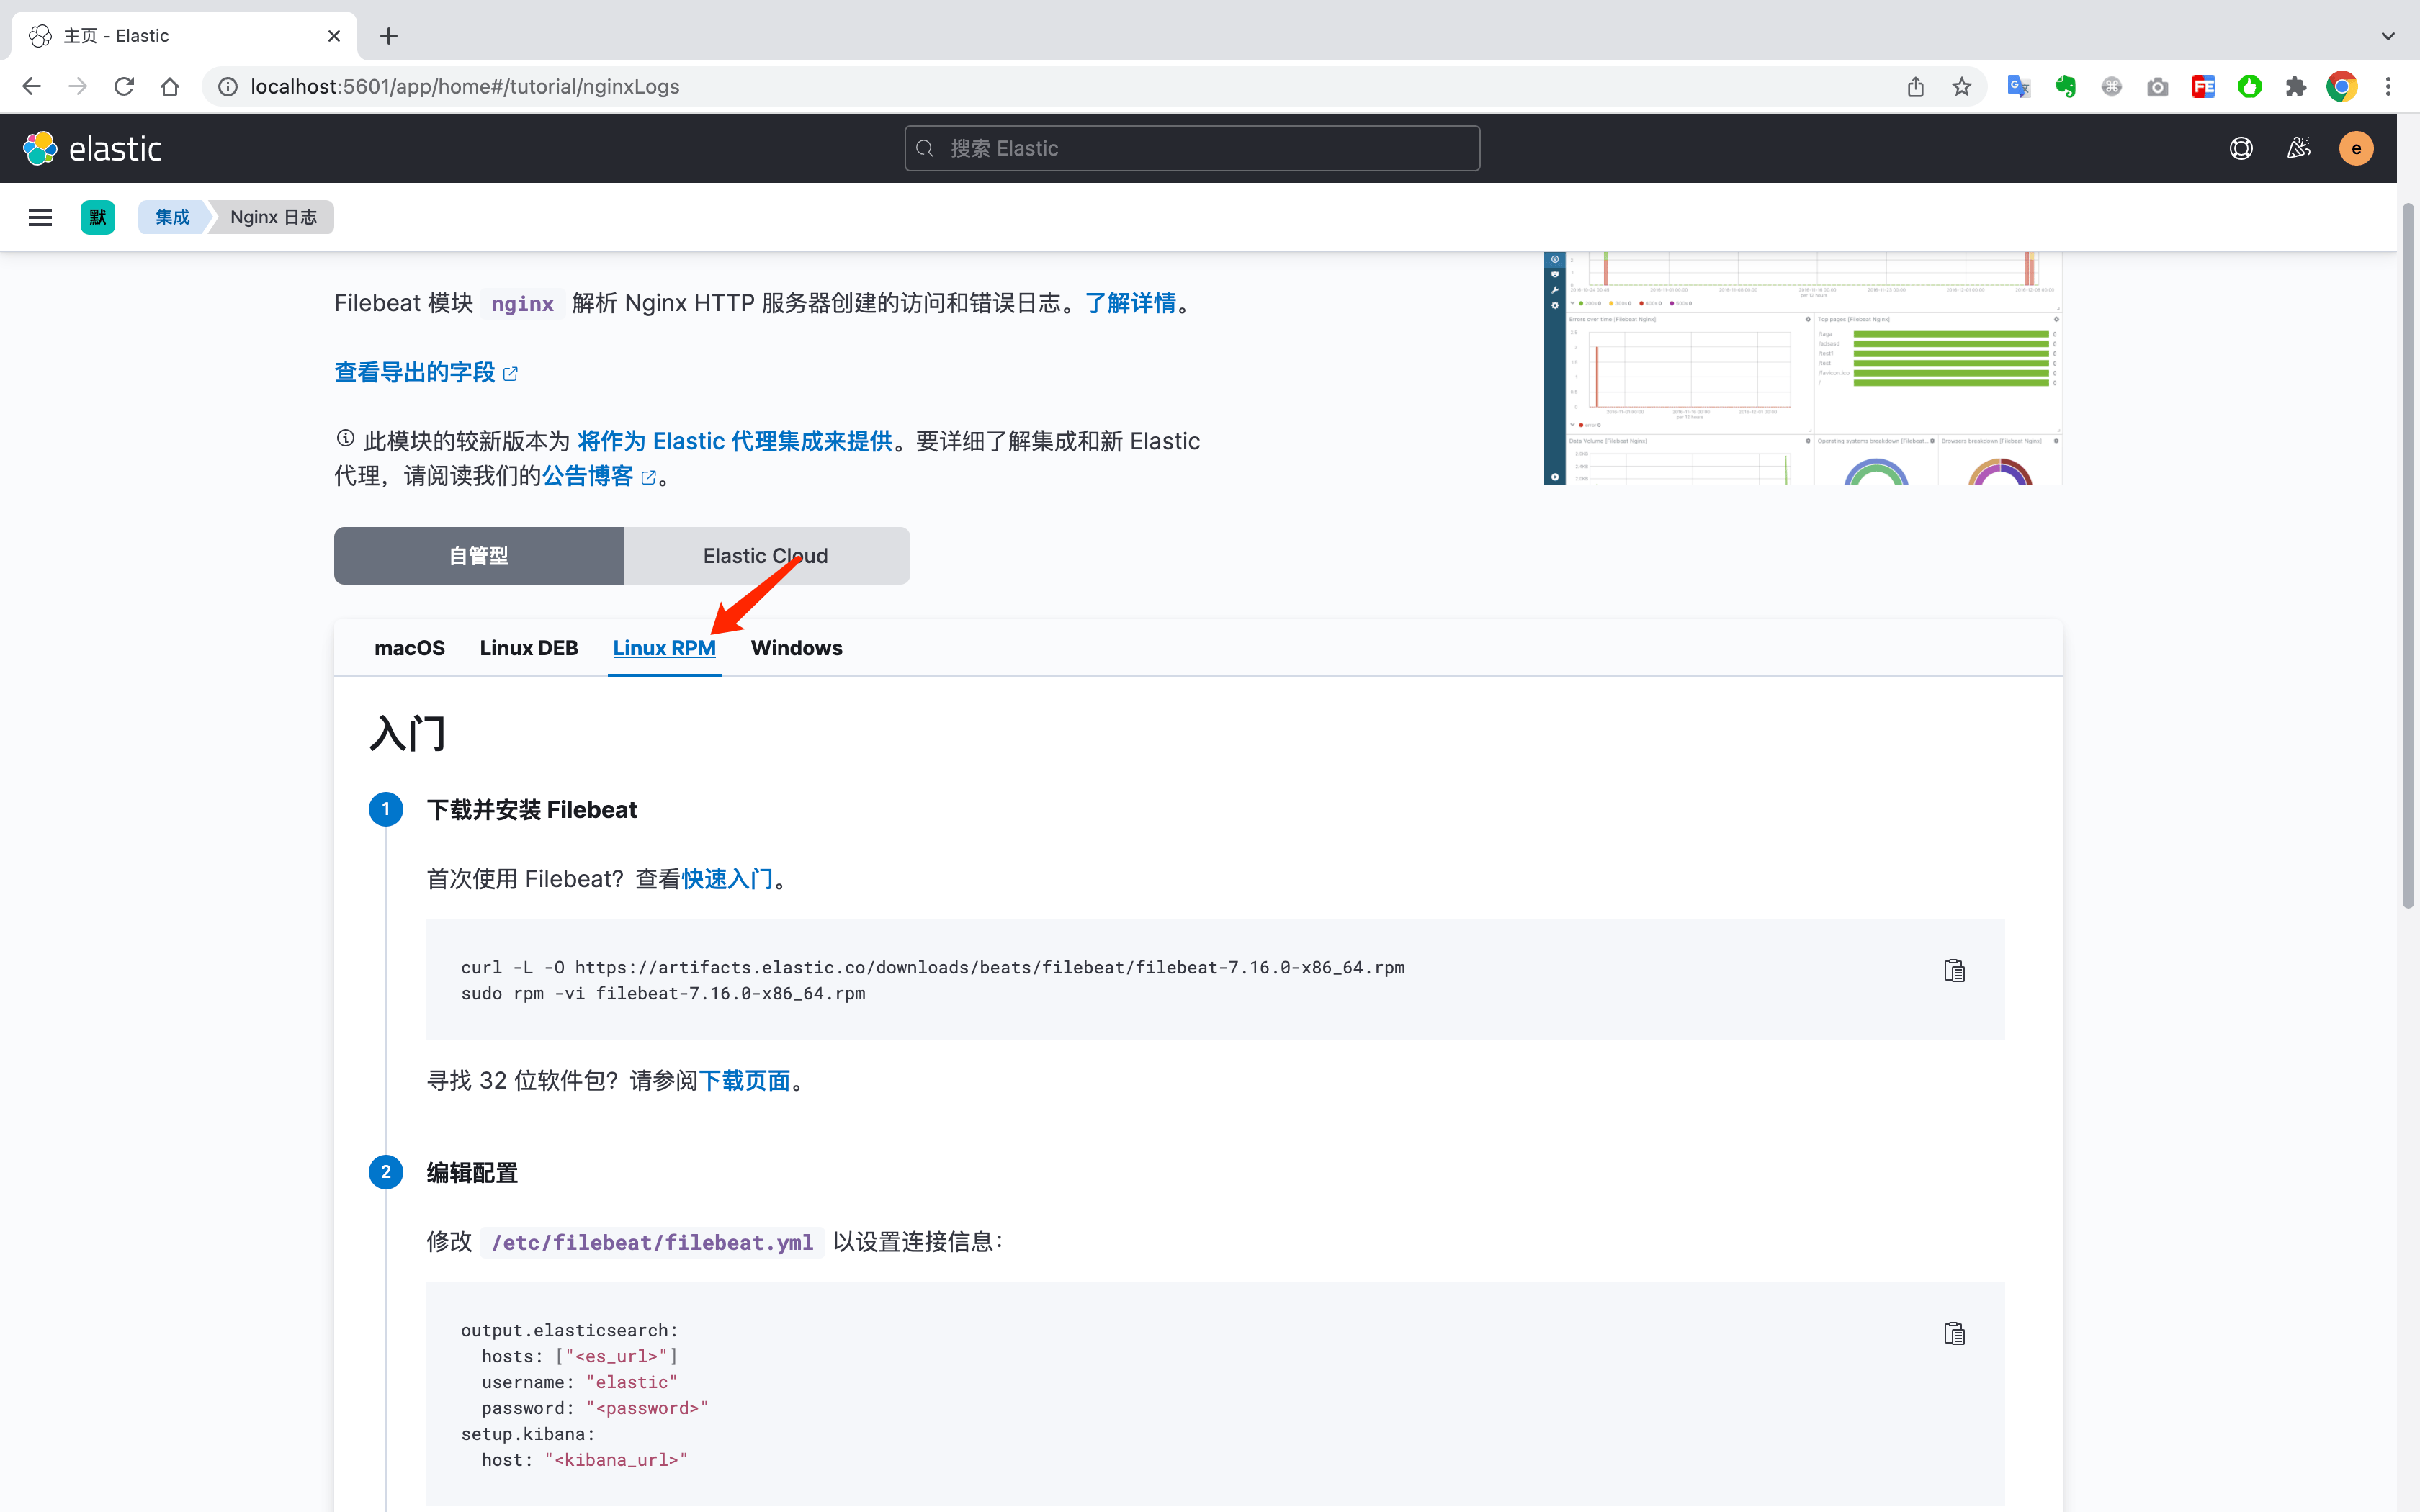
下载并安装Filebeat
bash
curl -L -O https://artifacts.elastic.co/downloads/beats/filebeat/filebeat-7.16.0-x86_64.rpm
rpm -vi filebeat-7.16.0-x86_64.rpm编辑配置文件/etc/filebeat/filebeat.yml 修改一下几个选项
yaml
output.elasticsearch:
  hosts: ["http://elasticsearch:9200"]
  username: "elastic"
  password: "xxxx"
setup.kibana: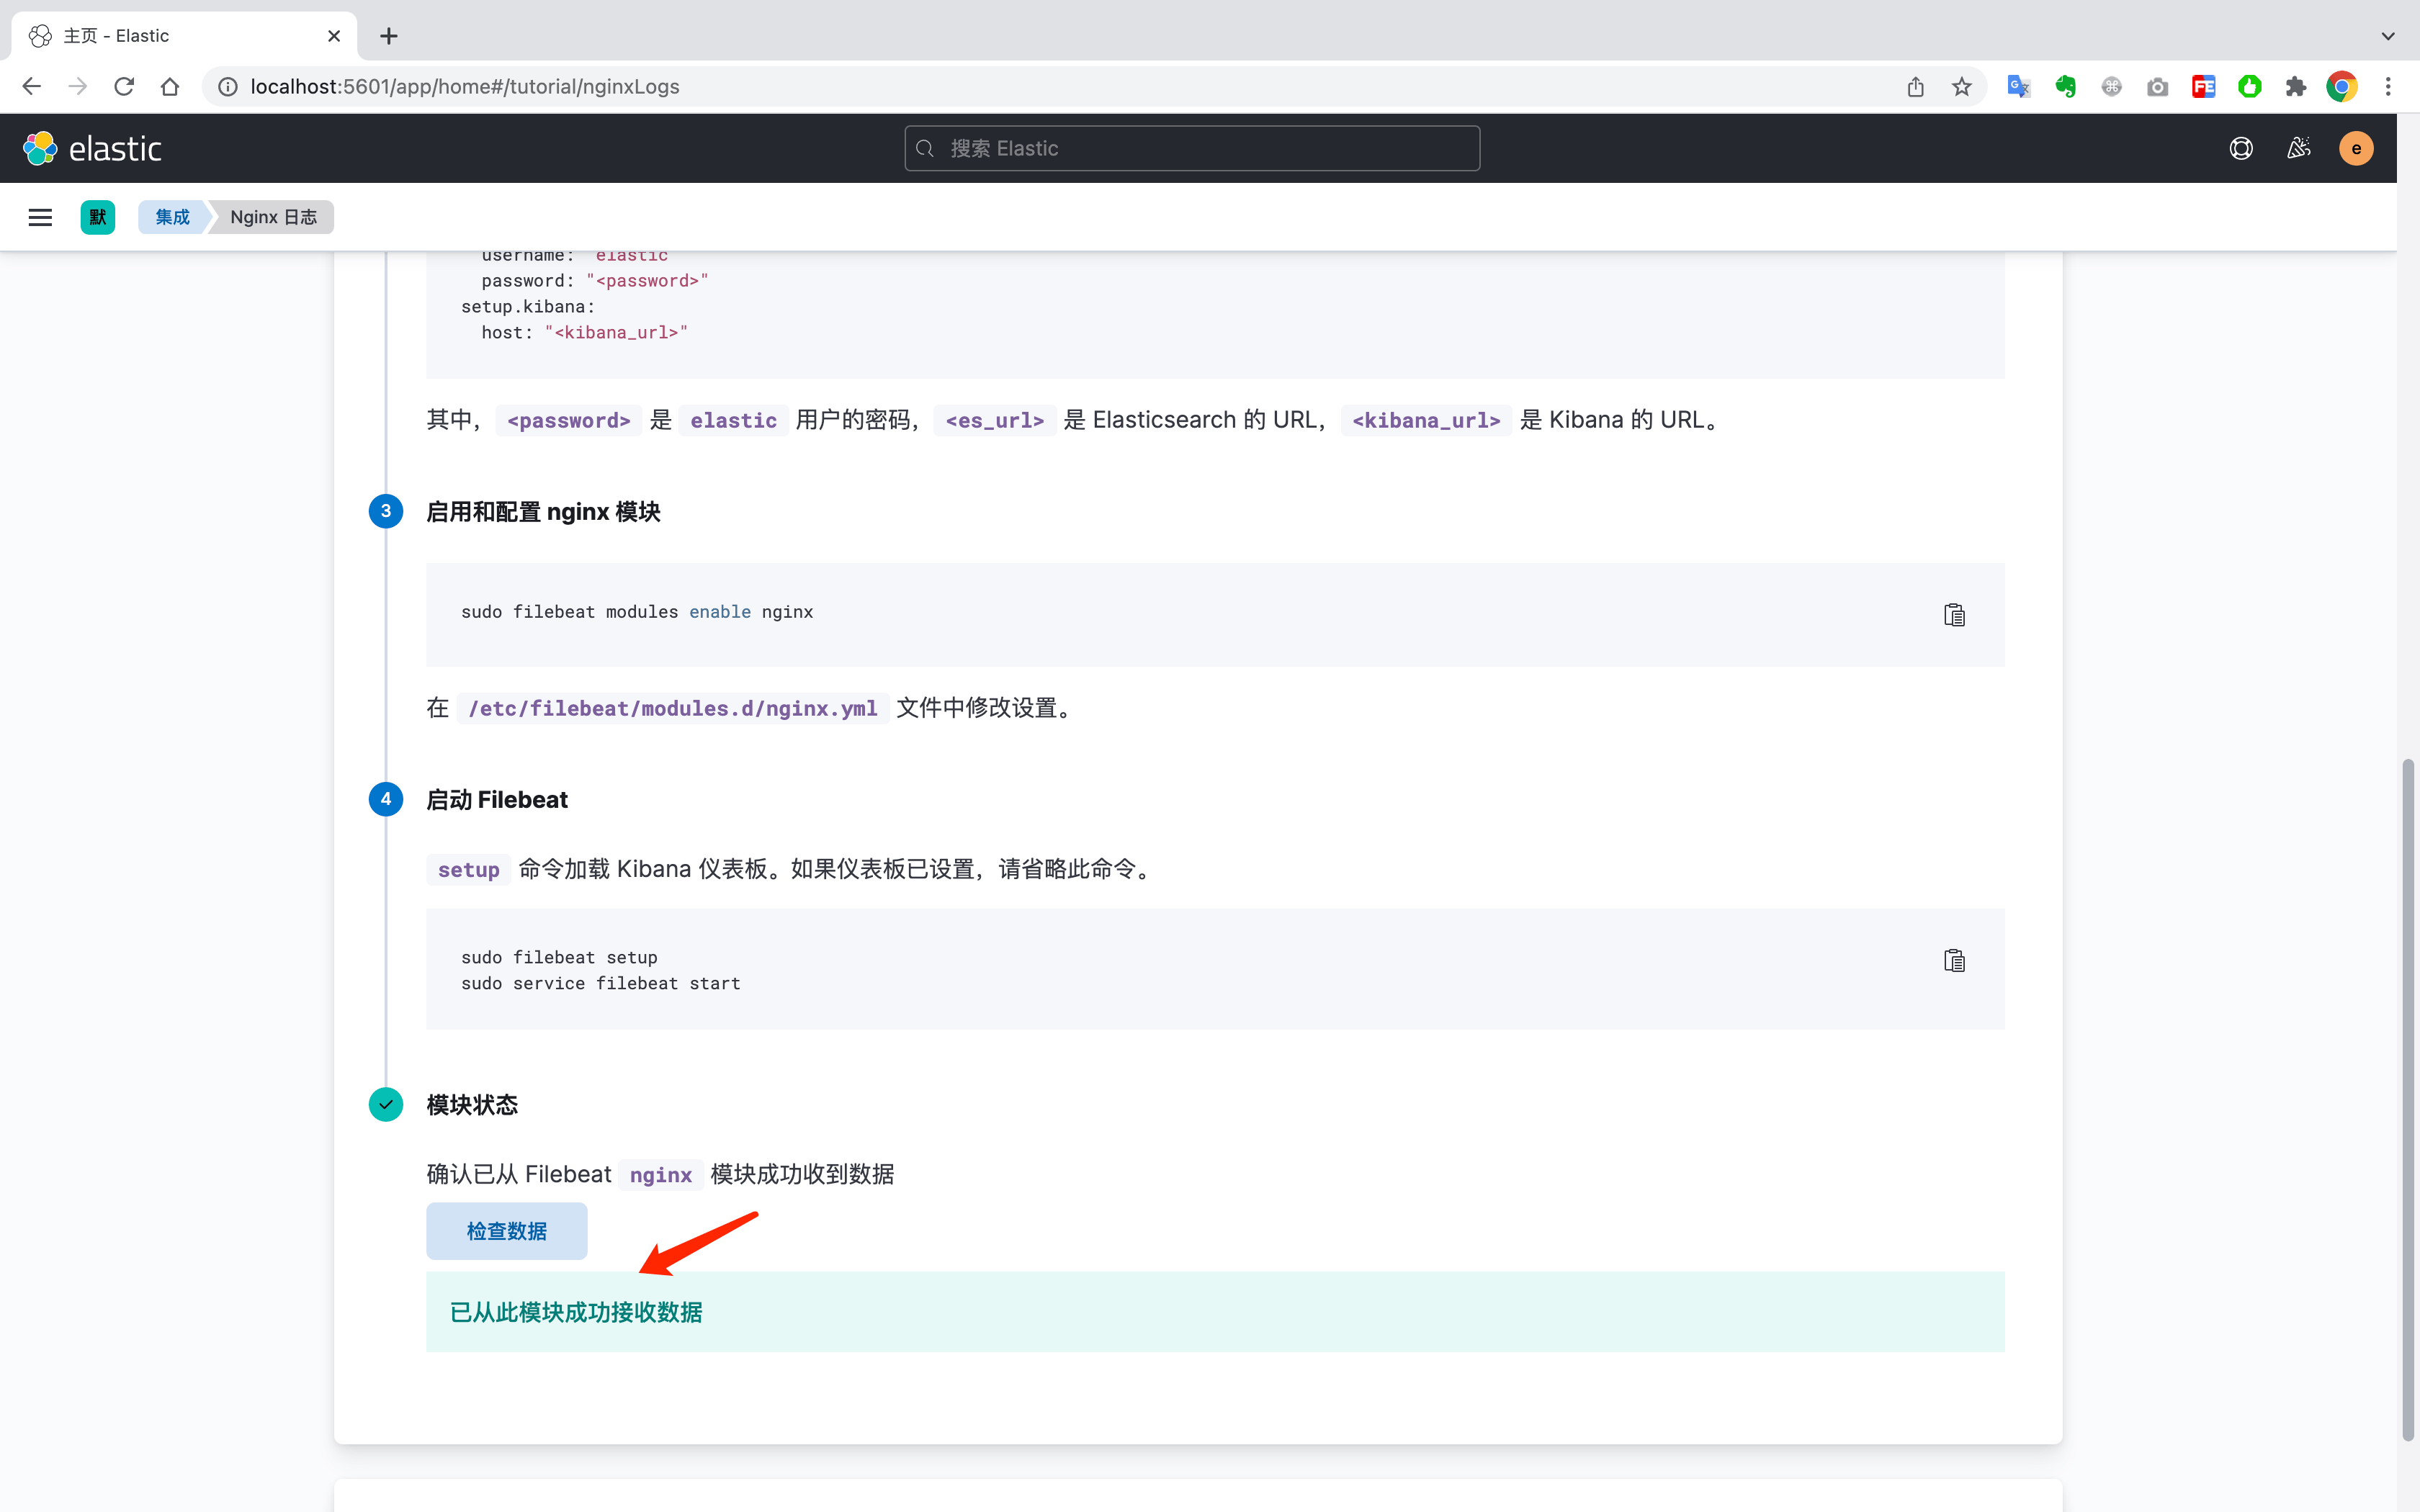
host: "http://elasticsearch:5601"启用nginx模块
bash
filebeat modules enable nginx加载kibana仪表盘
bash
filebeat setup启动filebeat采集任务
bash
filebeat run点击检查数据,此时说明已经安装成功了。
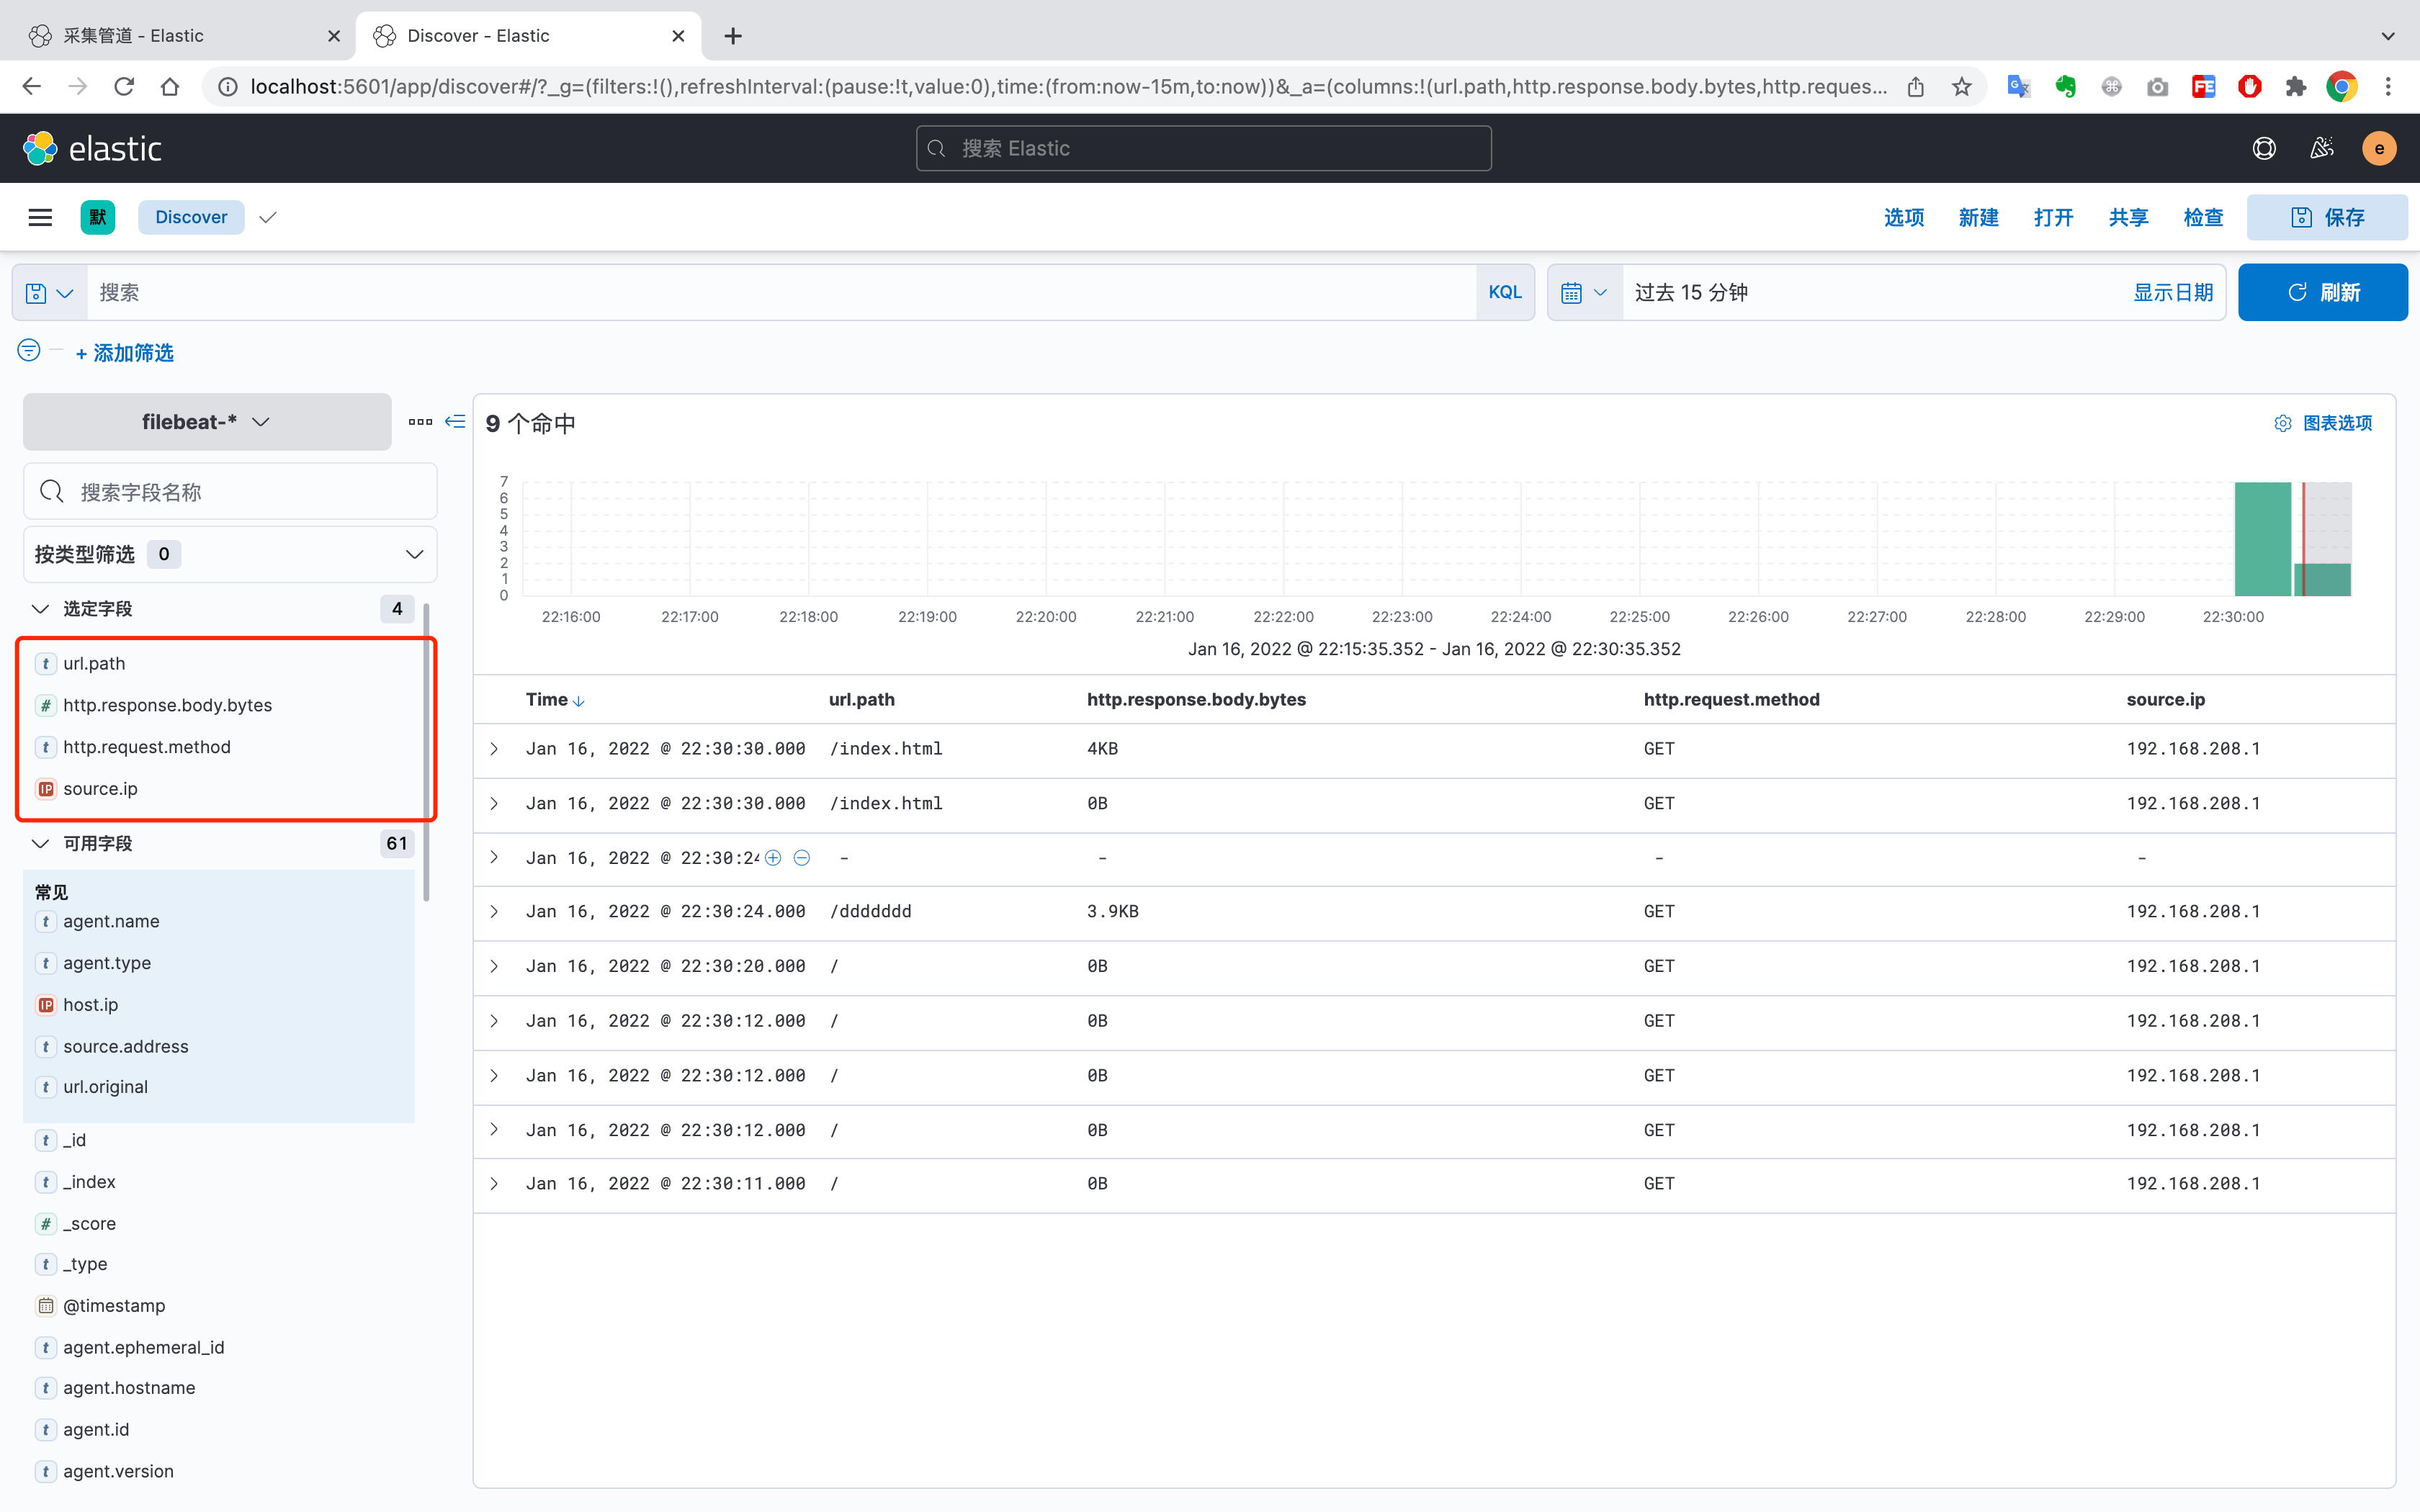
四、查看数据情况
访问几次页面后,查看日志情况

选择常用的字段
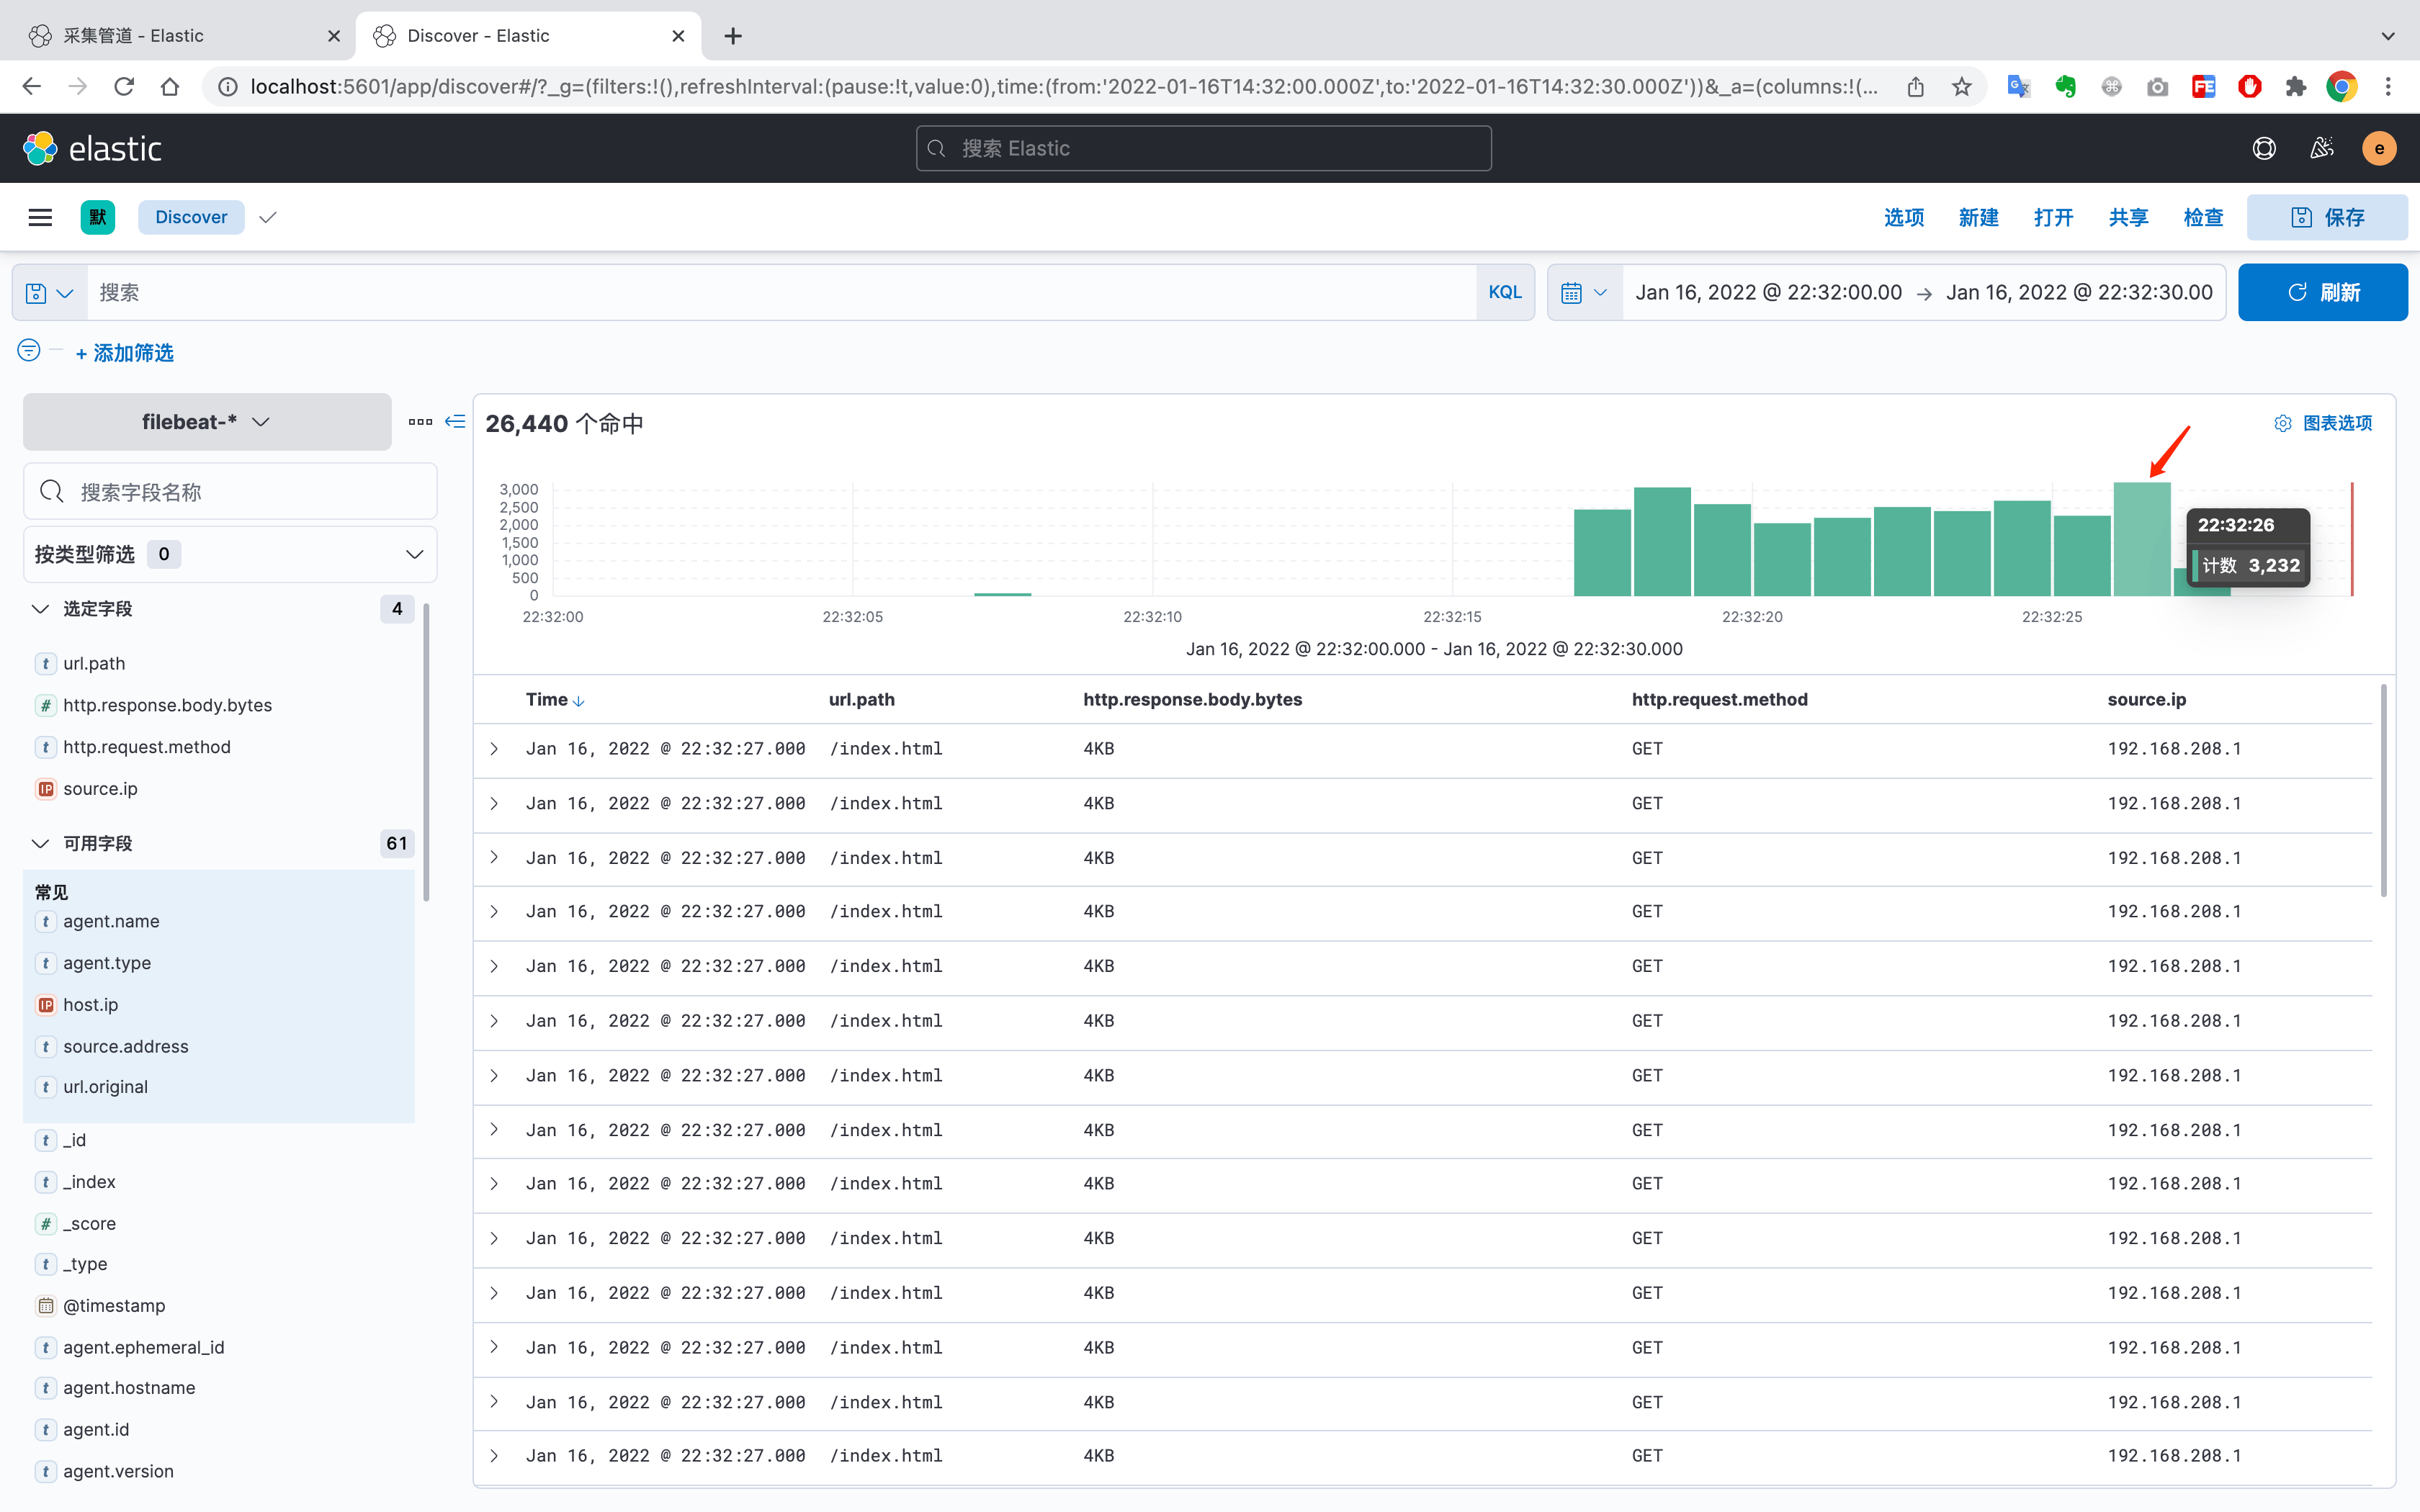
压测查看系统并发数
bash
wrk -t 4 http://127.0.0.1:8000/index.html选择时间,并查看系统的并发数
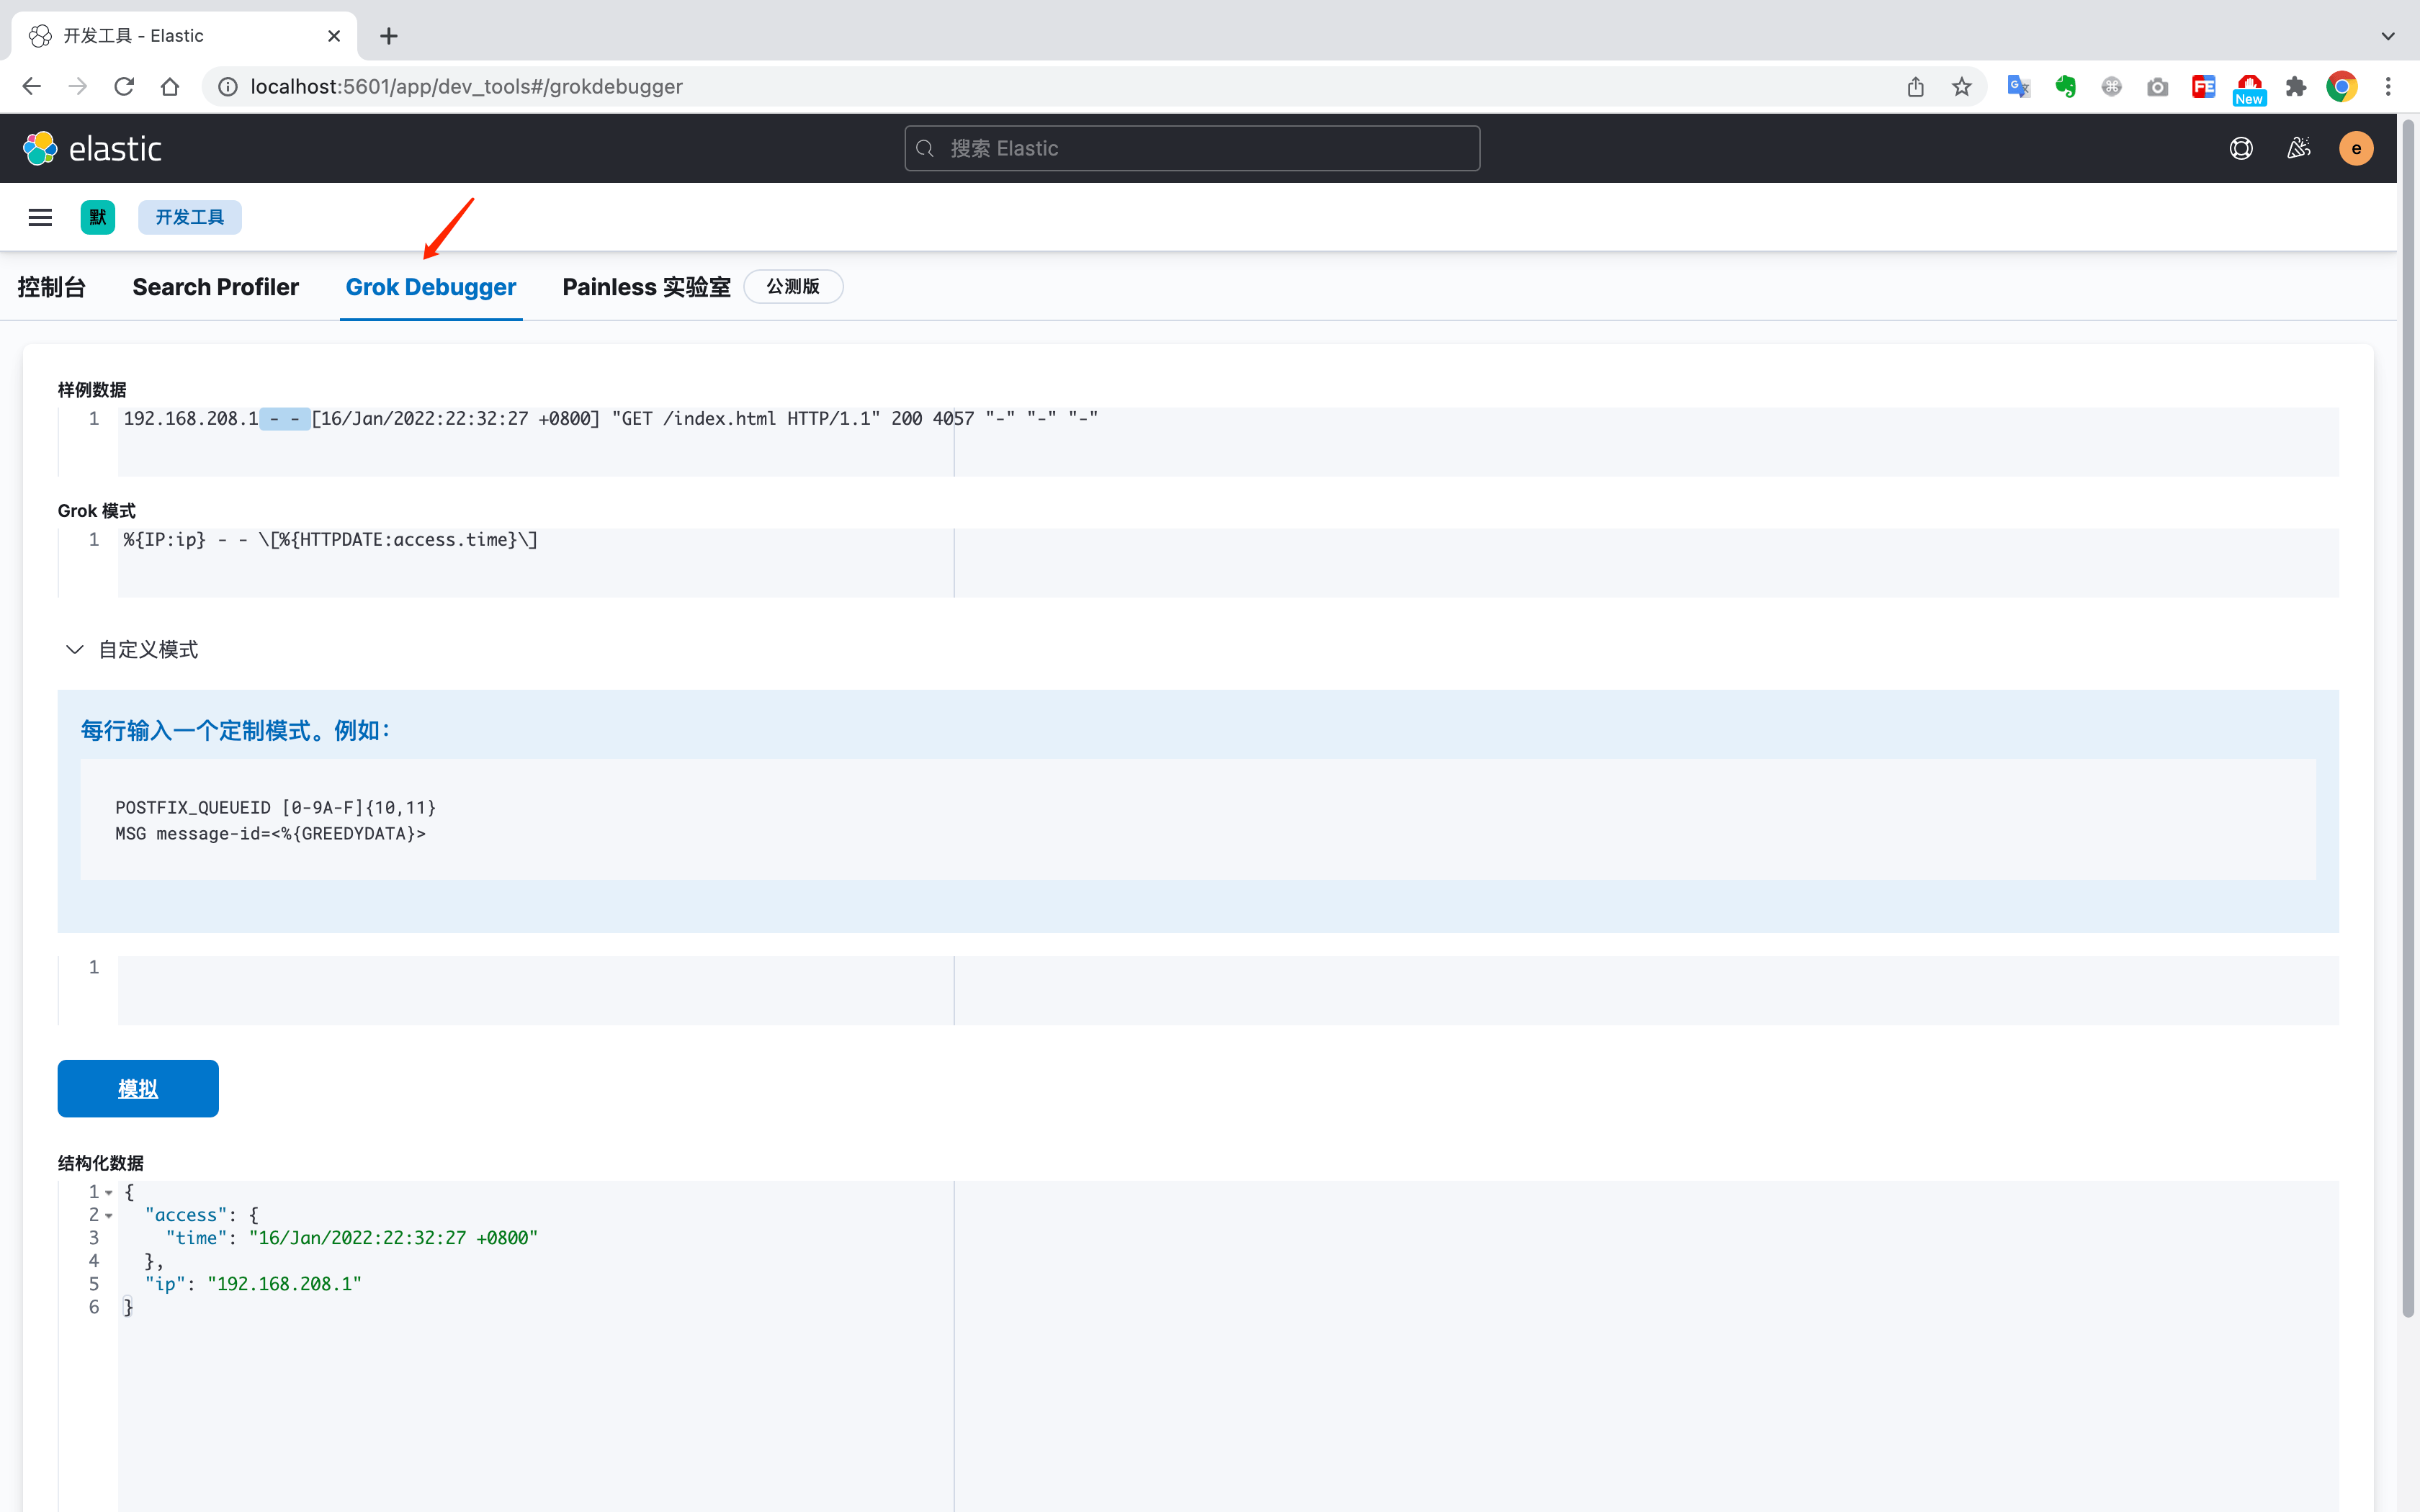
在采集管道里面,可以自定义日志格式
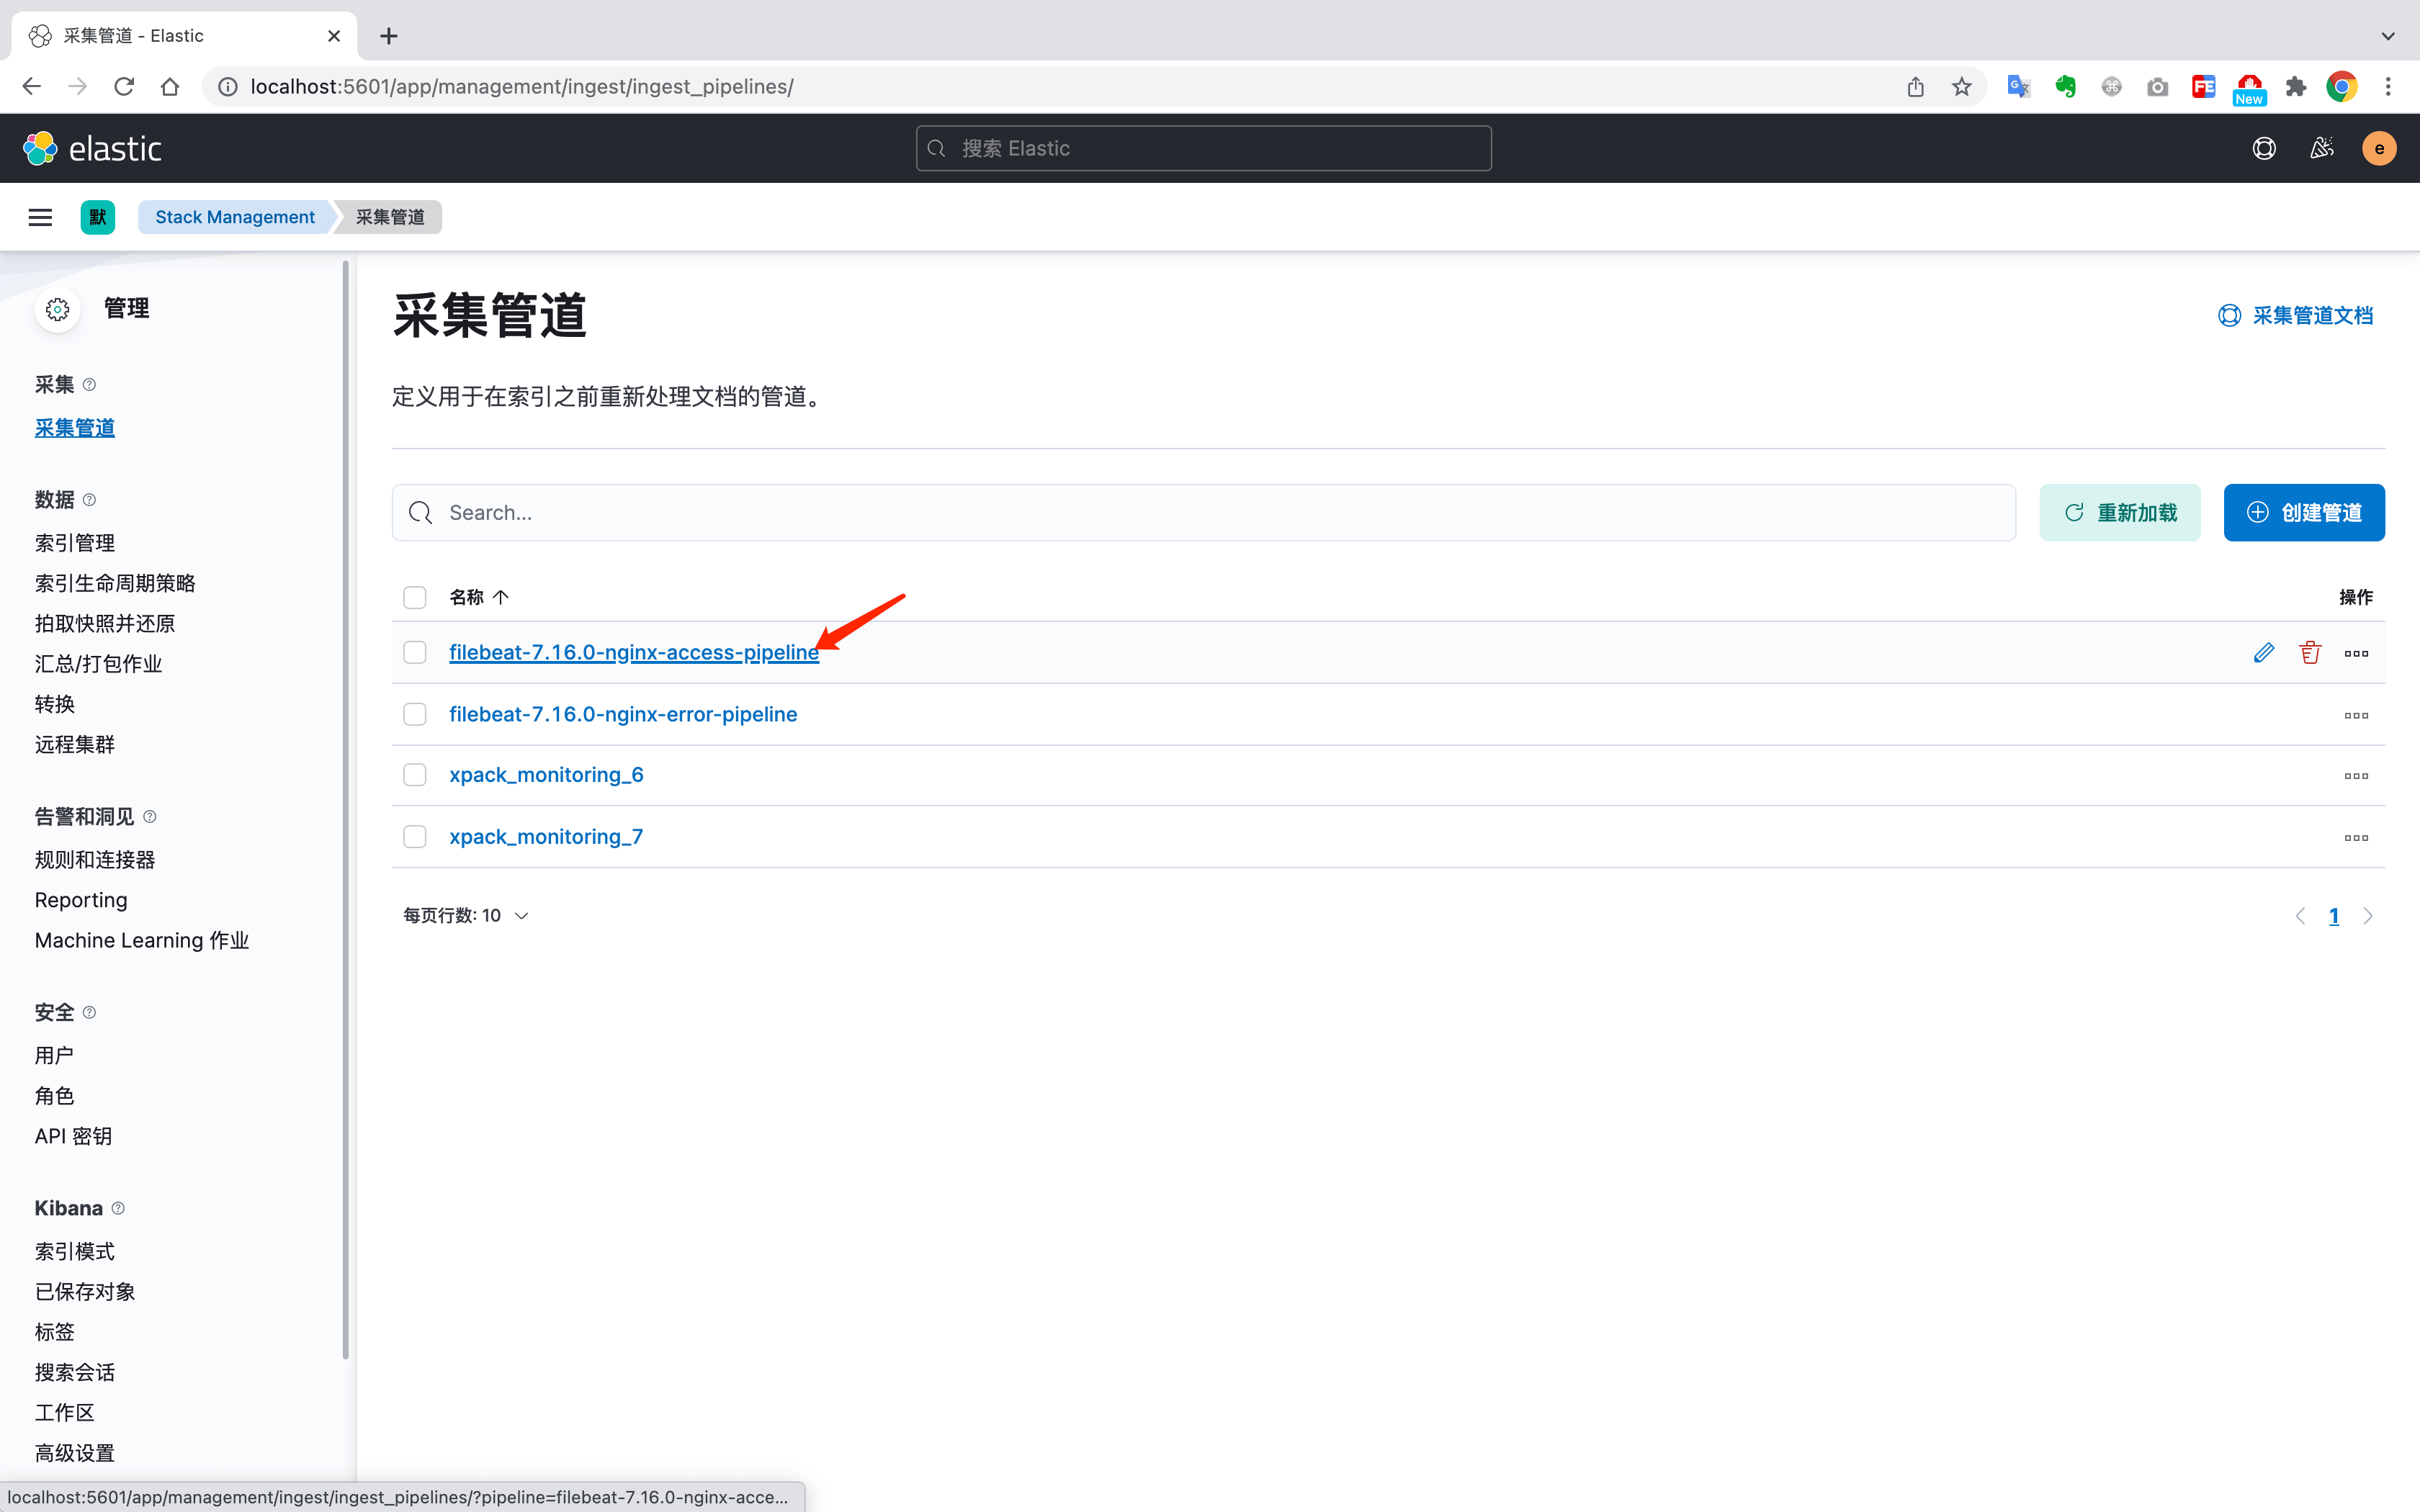
通过编辑处理器来自定义日志格式数据
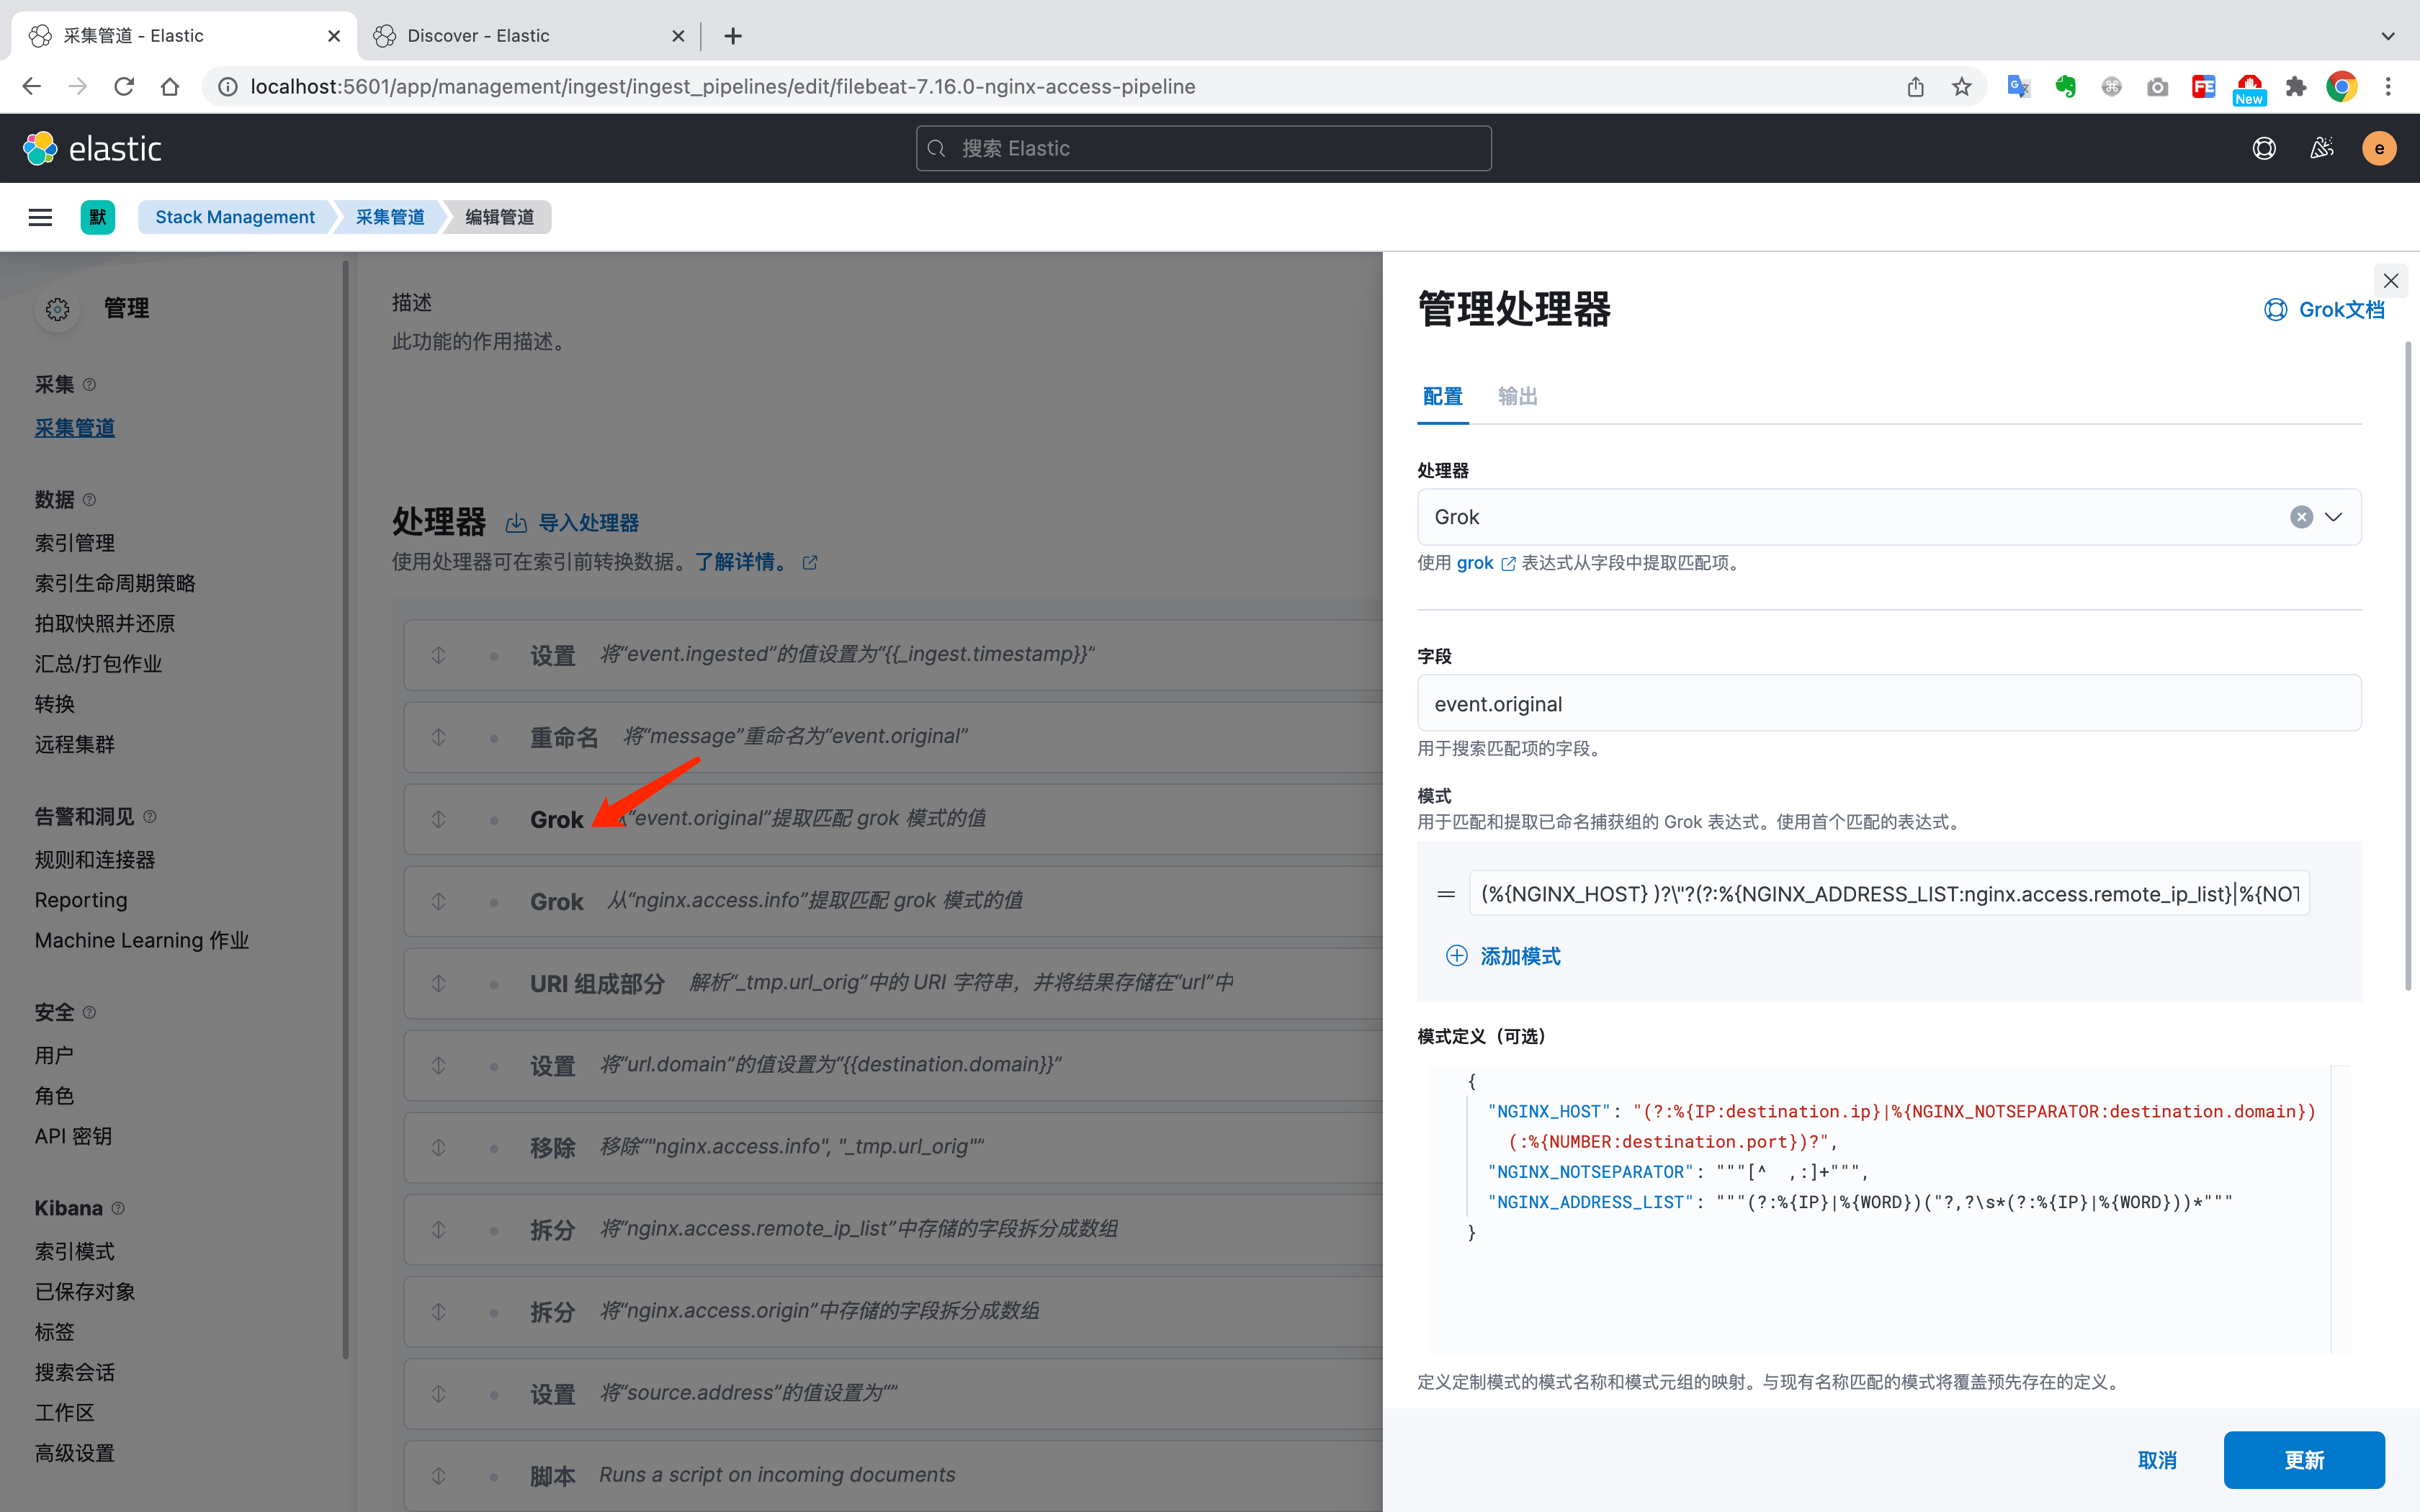
Kibana还提供了Grok调试器,可以直接在这里调试日志管道处理器